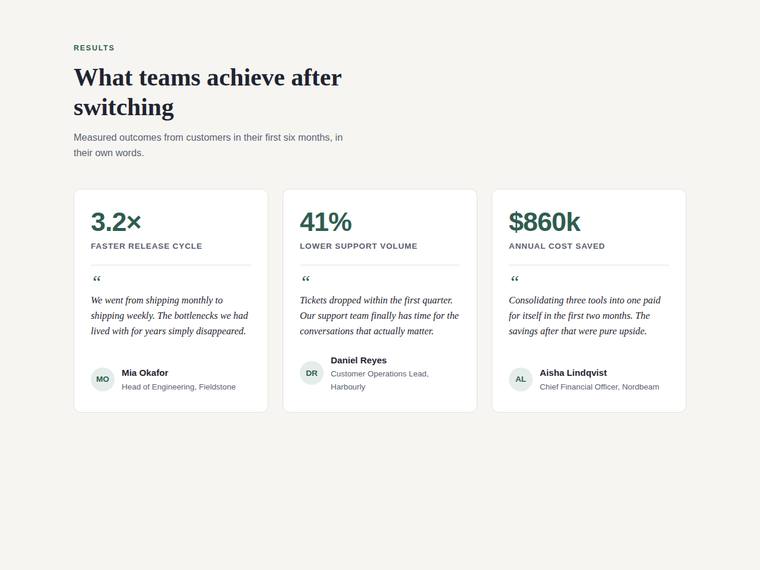
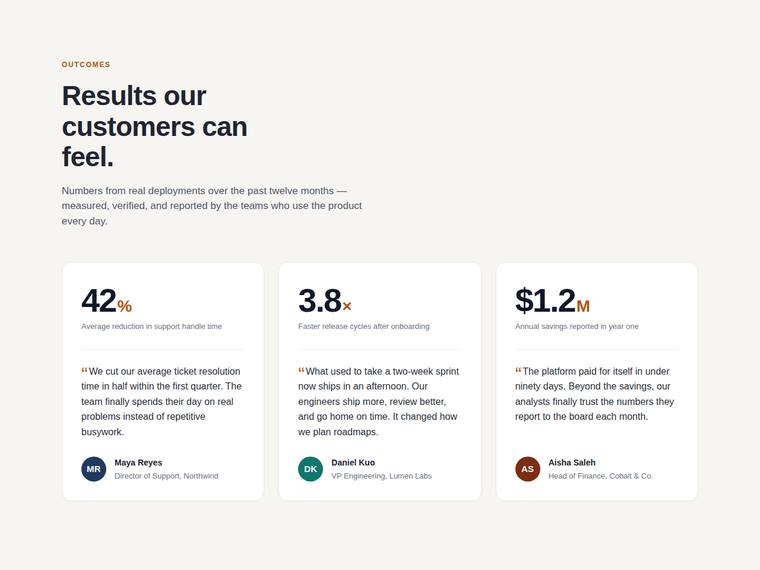
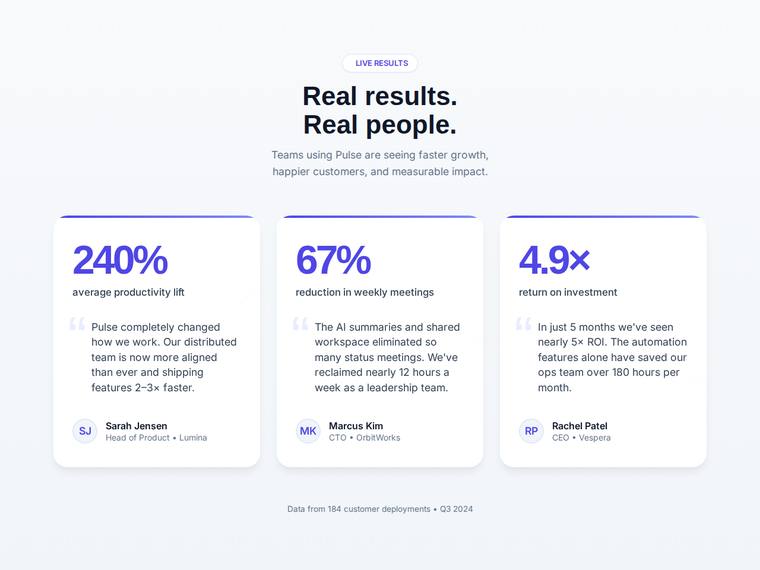
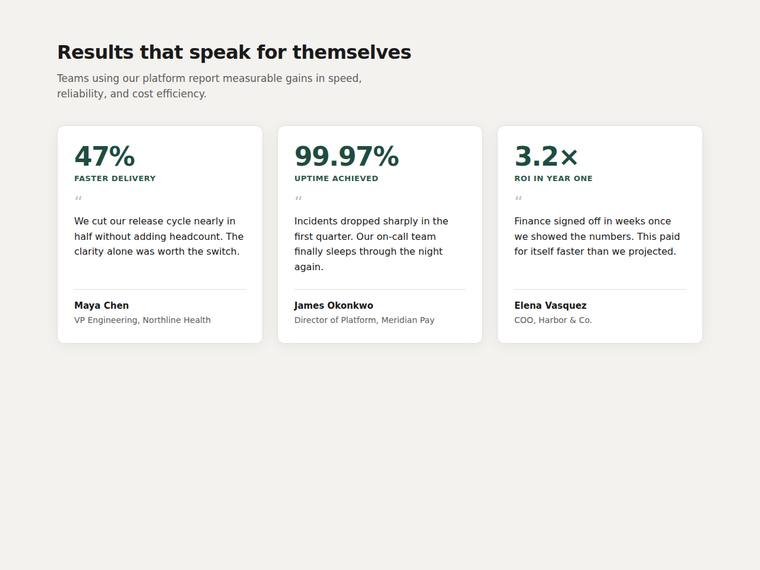
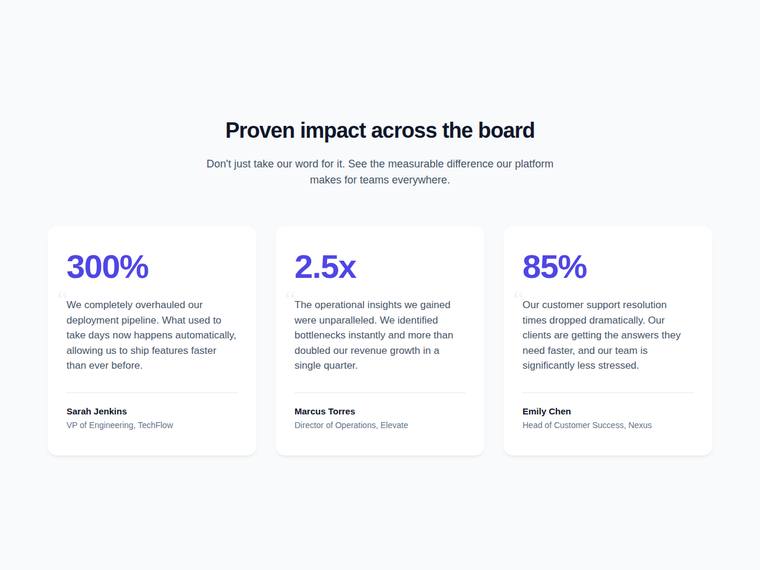
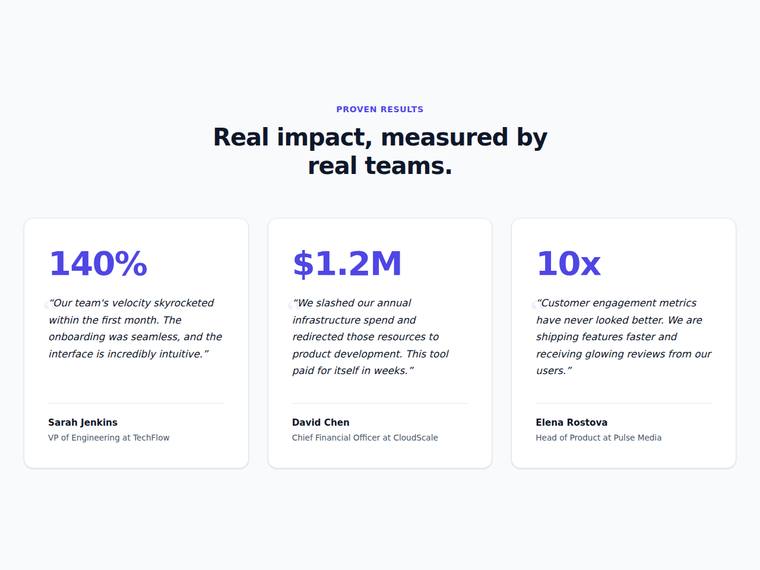
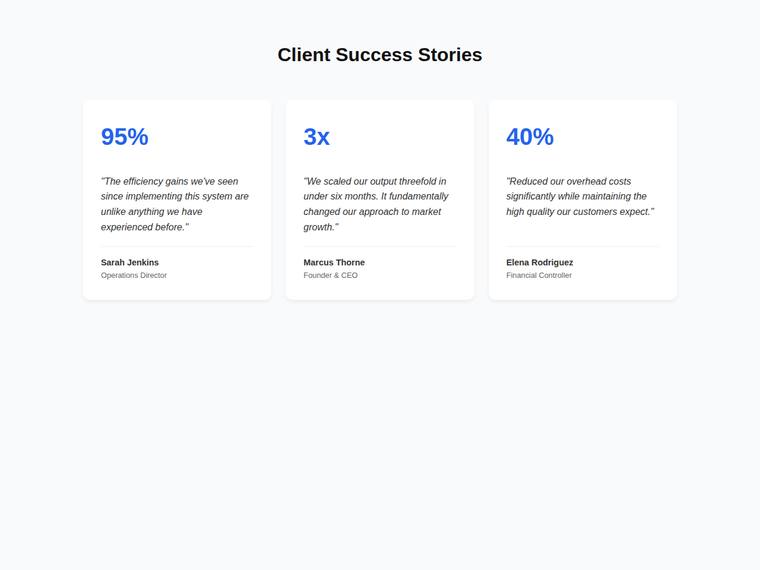
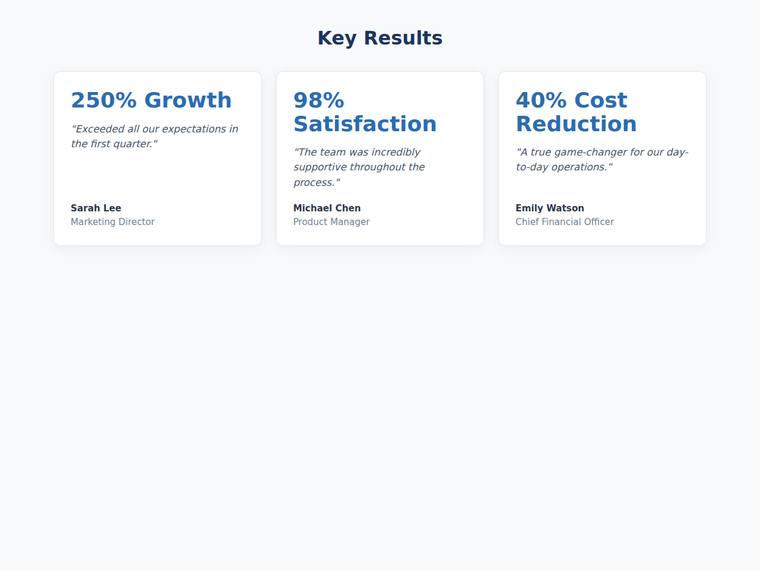
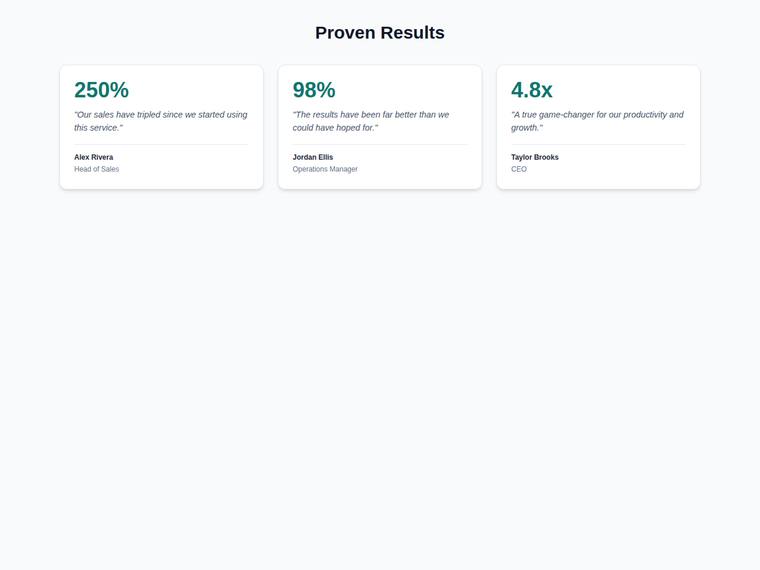
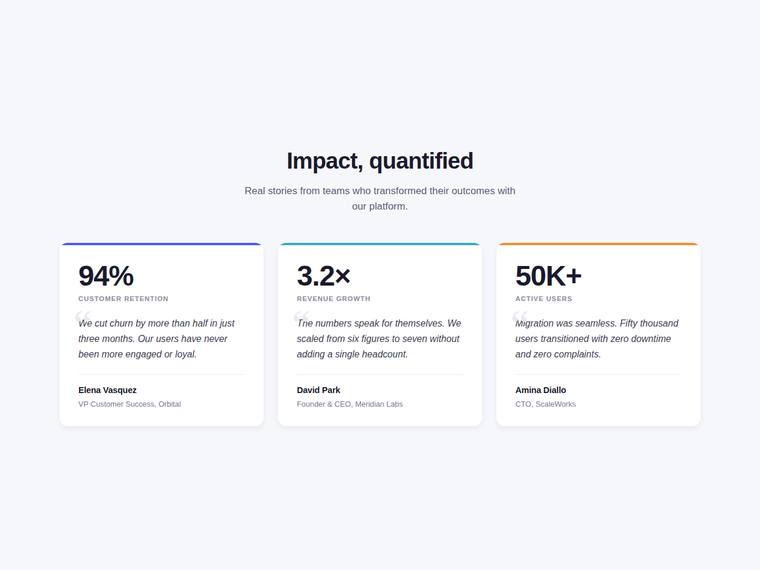
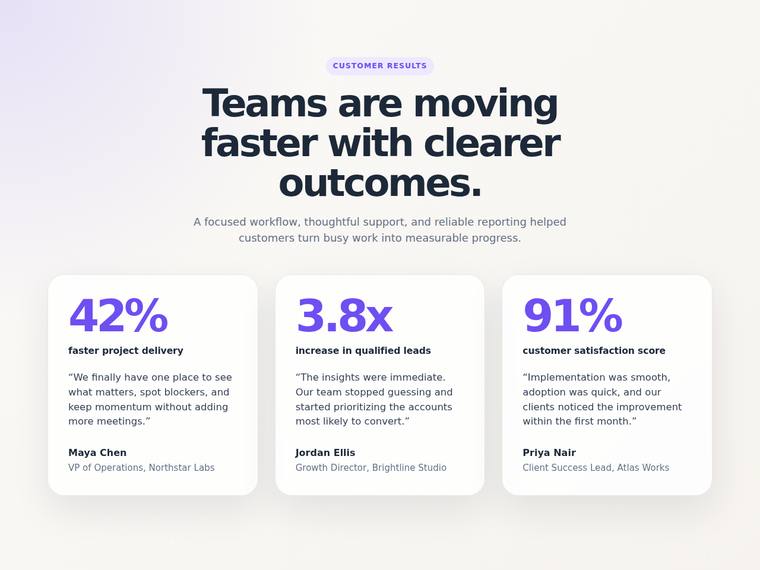
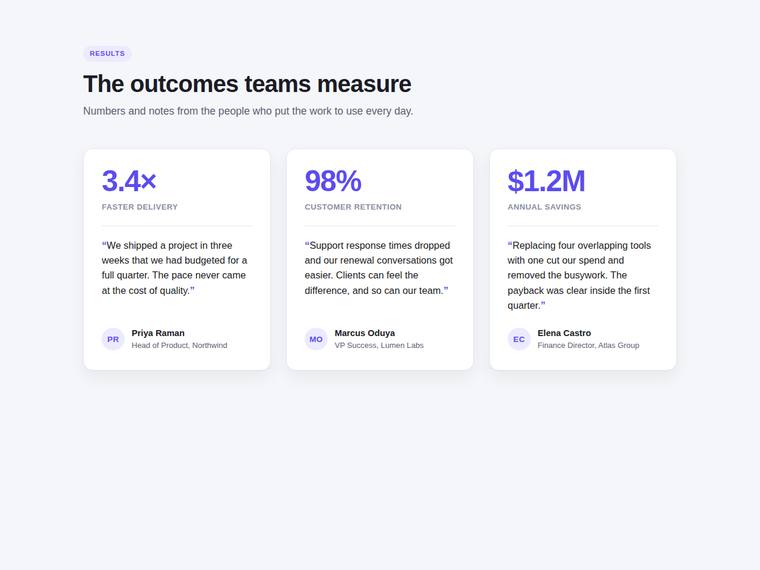
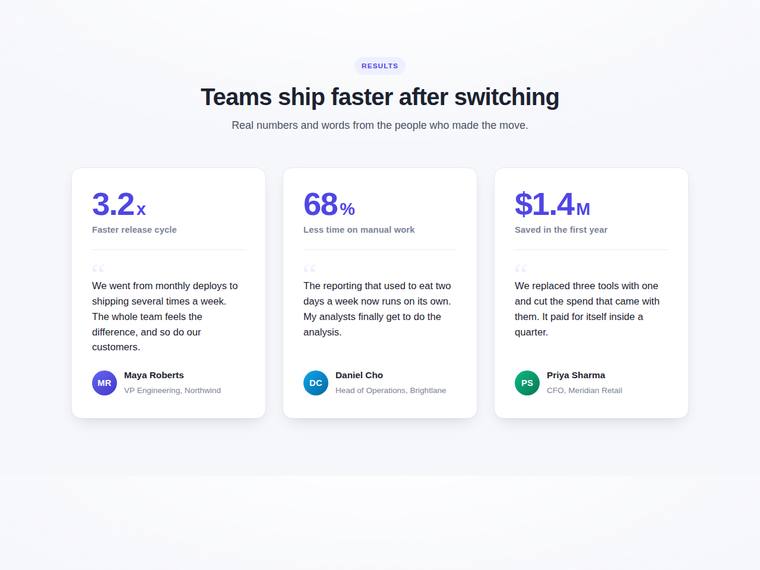
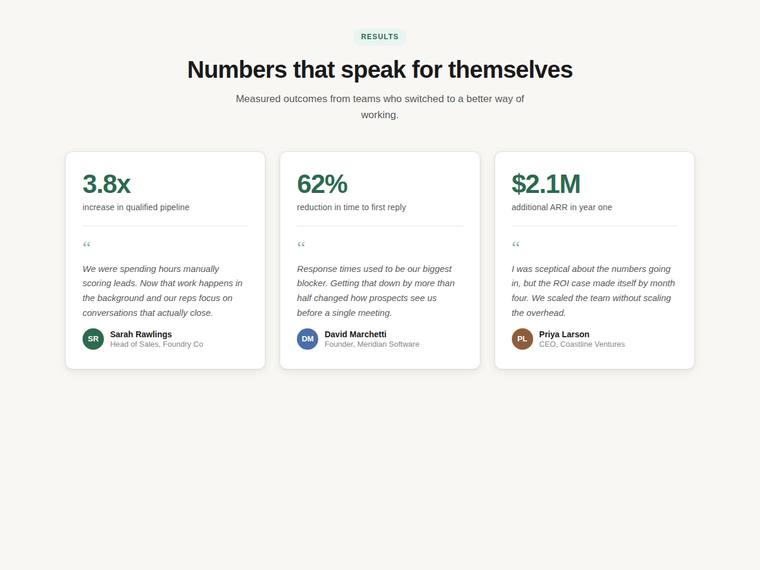
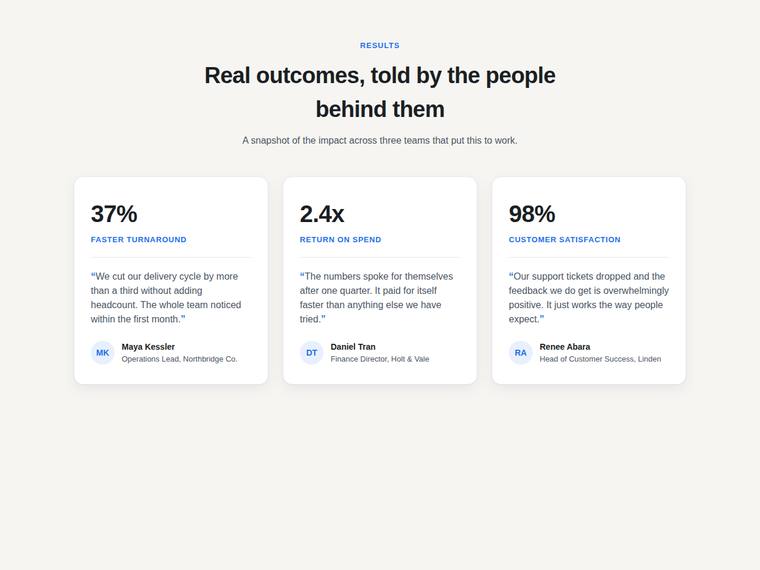
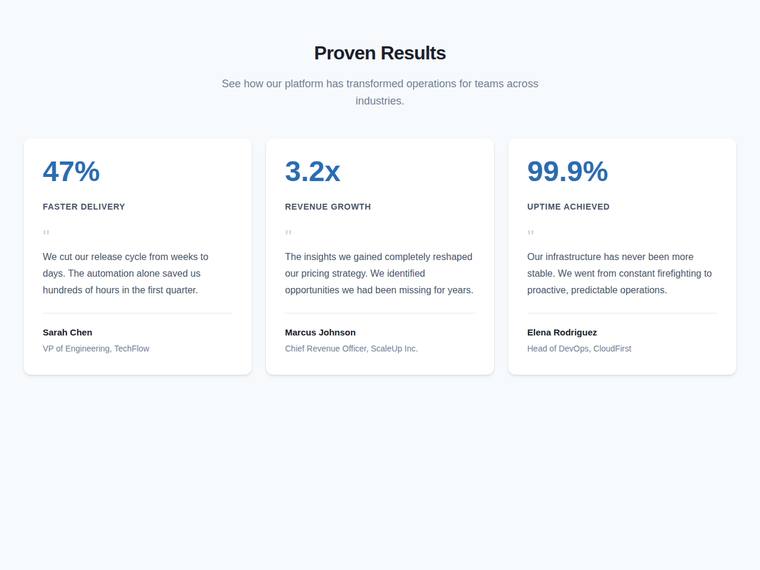
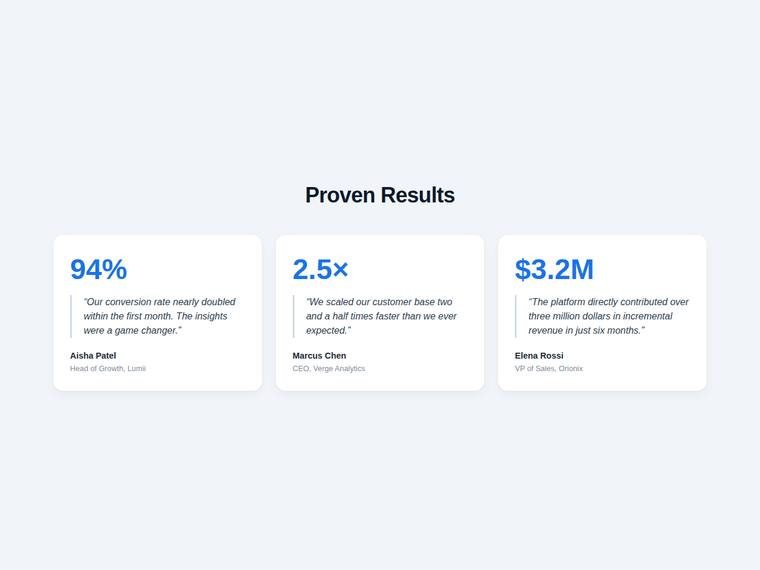
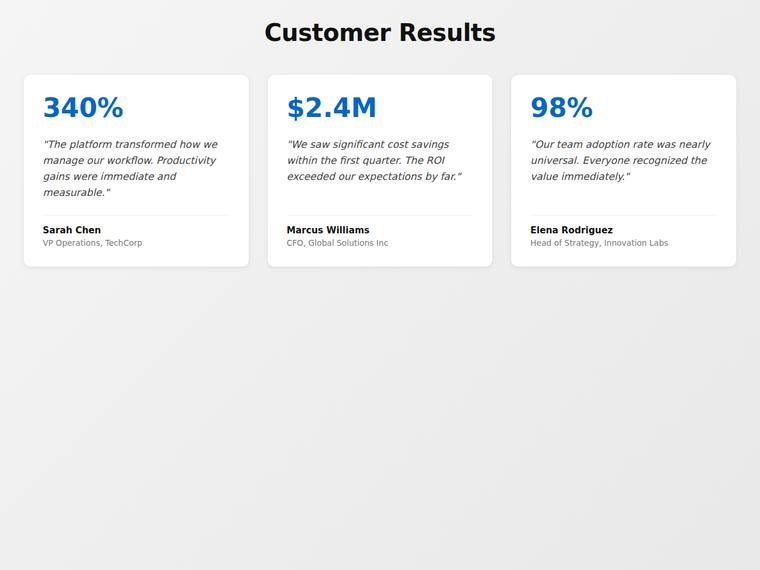
Stat and testimonial card grid
One task across 30 published runs. Inspect the scores and outputs together, with each run's execution method shown.
- Task
- UI-0005
- Domain
- UI components
- Difficulty
- easy
Leading published run: claude-opus-4-8 (low reasoning) at 100.0% composite. Lowest: claude-haiku-4-5 at 0.0%. 30 published runs shown on this task.
How this task was evaluated
Results are ordered by this task's published score. API runs use one prompt and one completion; agent runs use a coding harness with tools and iteration. Inspect the execution method when comparing results.
Objective scores use the benchmark's execution checks. Judge scores use a vision panel's fixed rubric; the published score leaves out a model's own family. Missing values are labelled rather than treated as zero.
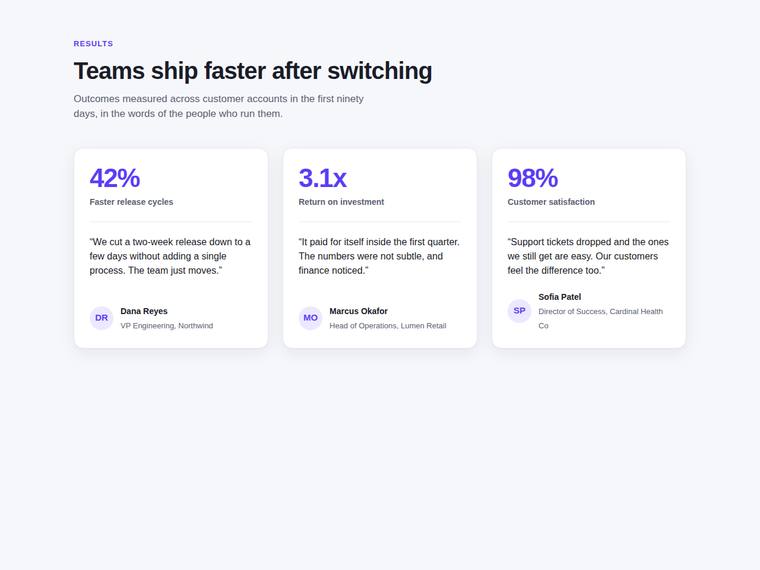
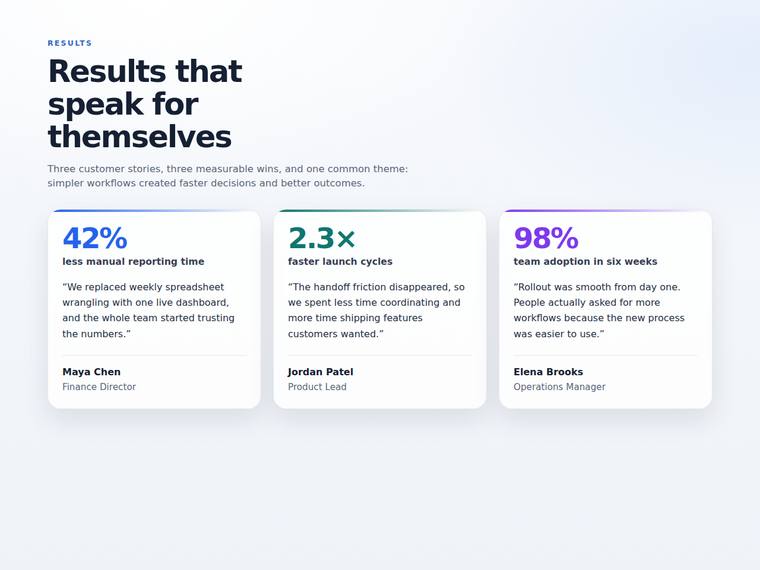
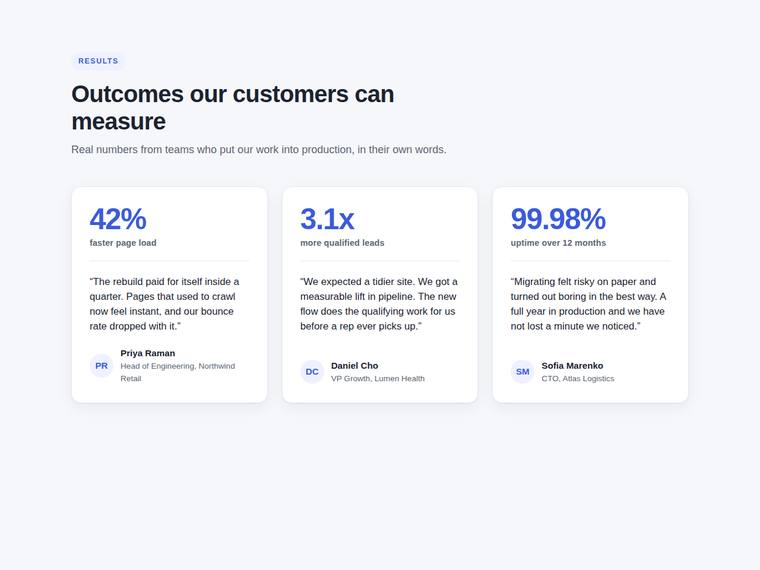
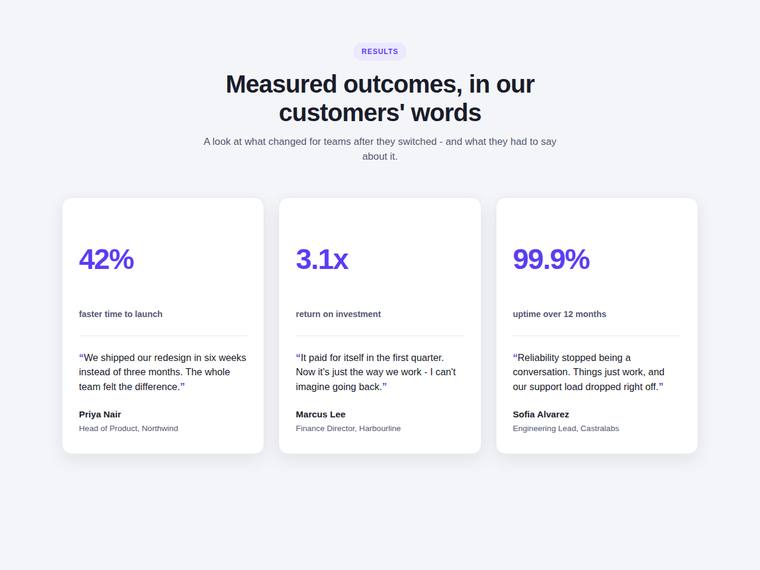
Read the brief
Build a self-contained results section as a single HTML file (`index.html`) that renders with no build step and no network calls (inline all CSS and JS). Requirements: - a clear section heading, - exactly three cards laid out as a responsive grid; each card pairs a headline statistic with a short testimonial quote and an attribution (name and role), - on a narrow screen the cards stack to a single column with no horizontal scroll. This is a visual piece: aim for balanced spacing, a clear hierarchy, and tasteful type and colour. Use plain, readable markup. No external fonts or scripts.