Banja Lab / Benchmarks / Test
SCREE-0002Websites · hard
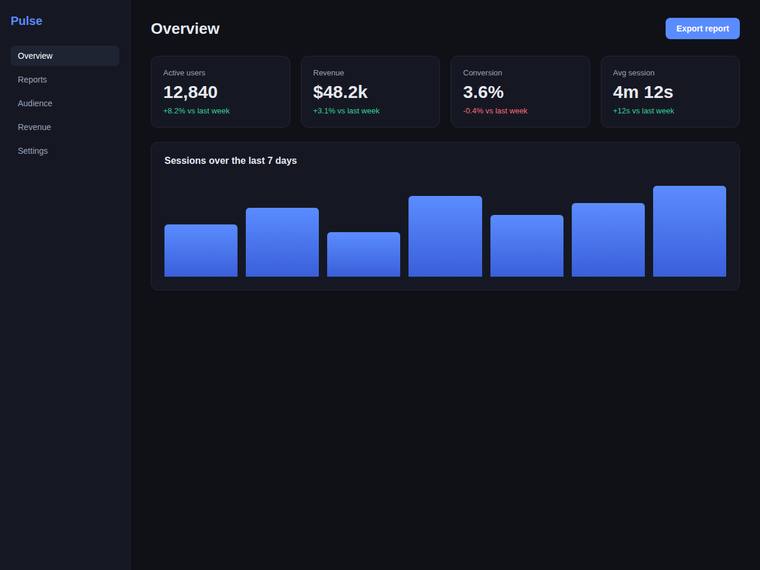
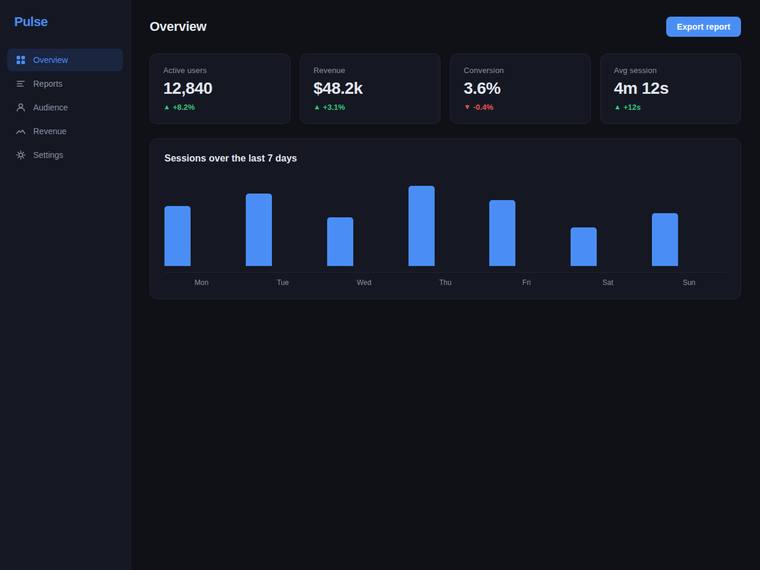
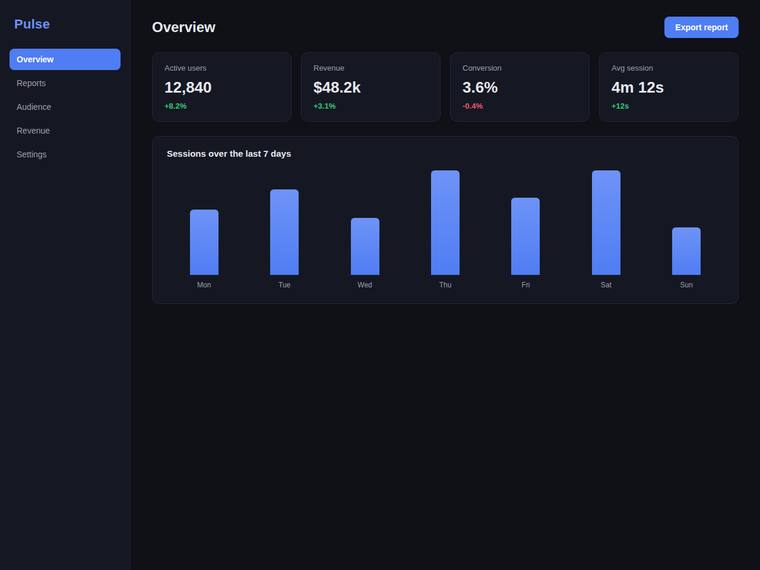
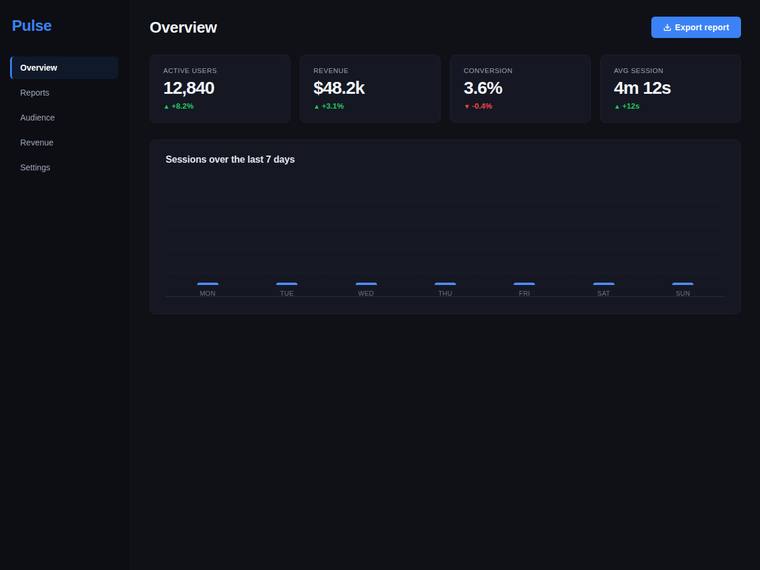
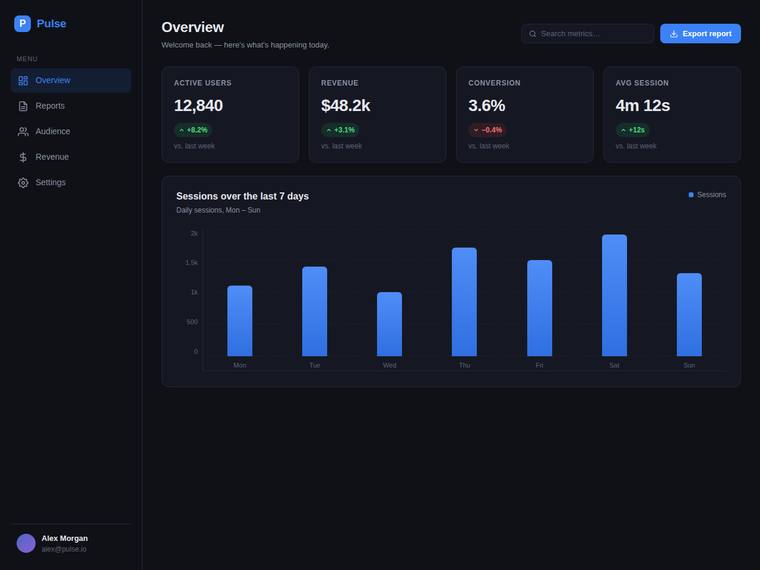
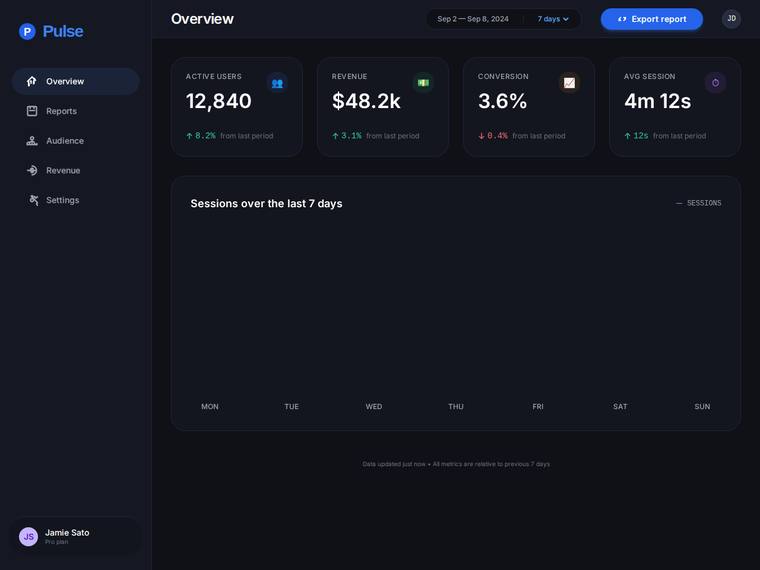
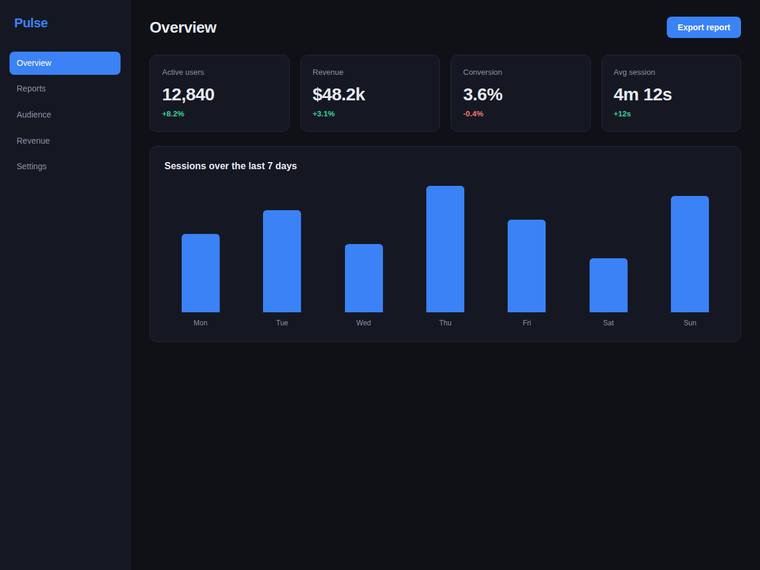
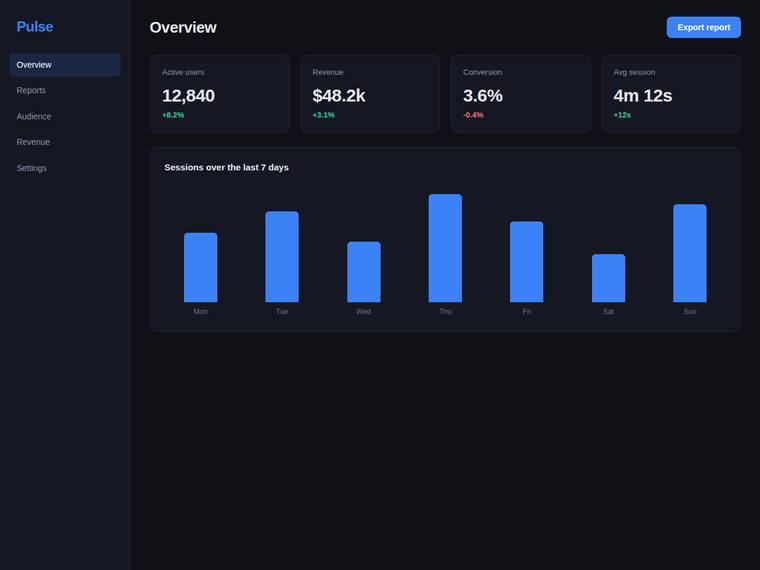
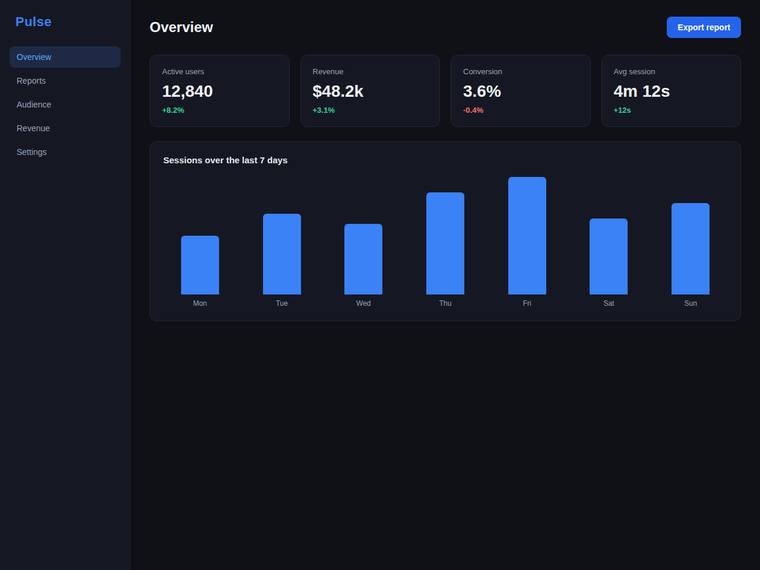
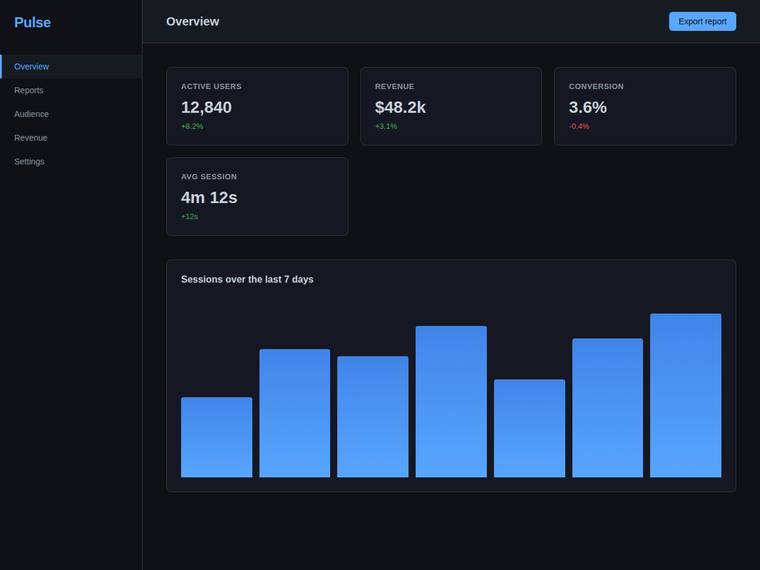
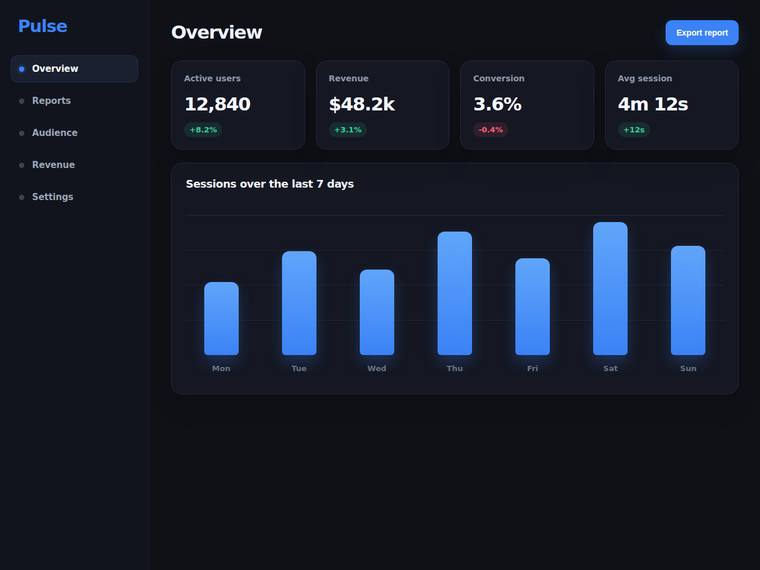
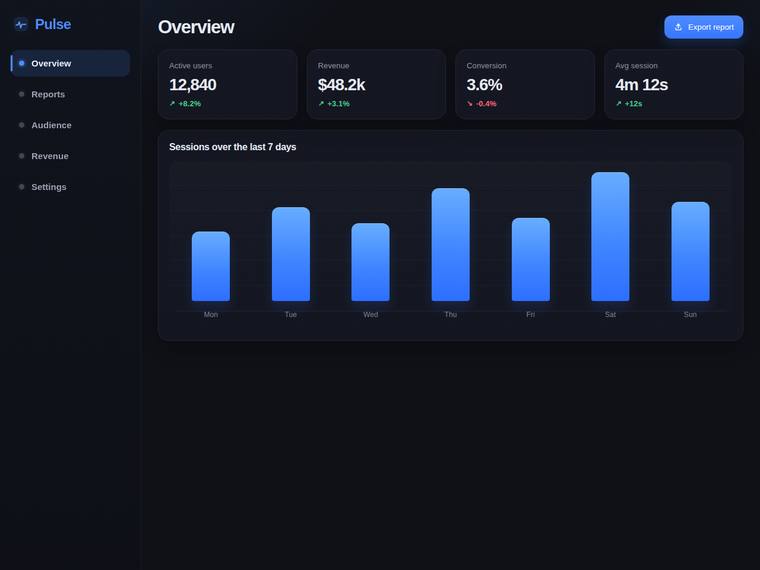
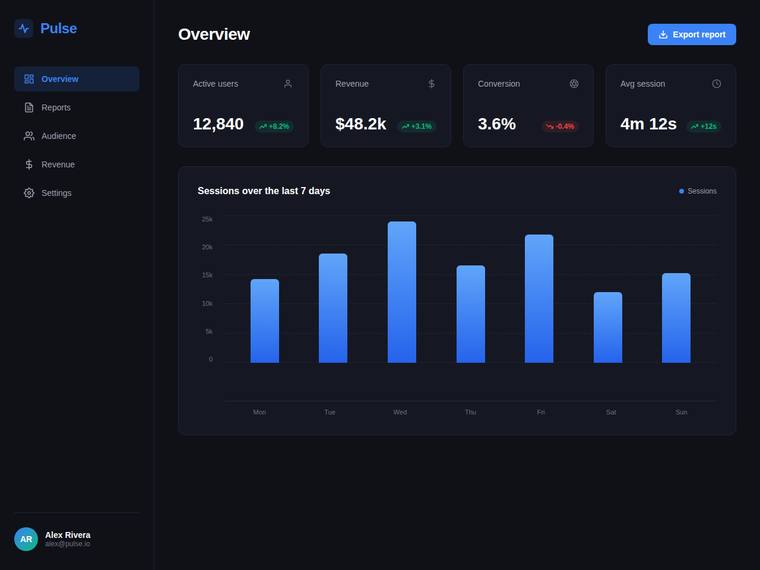
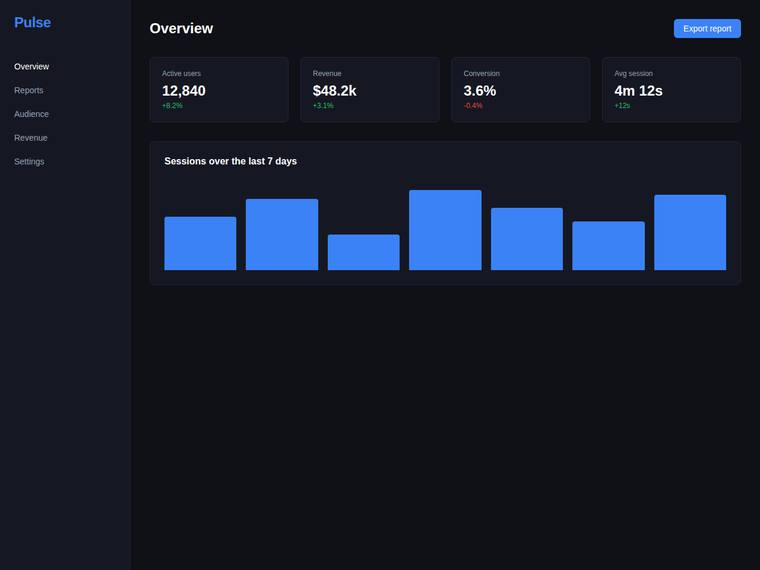
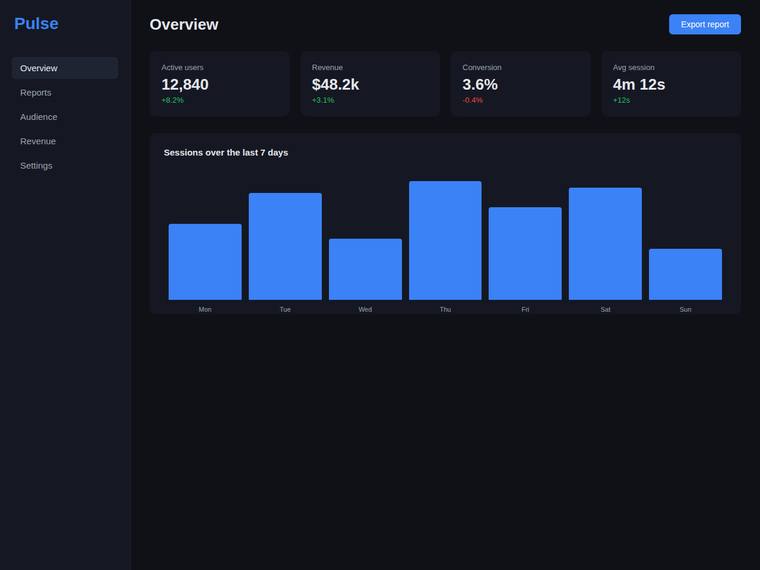
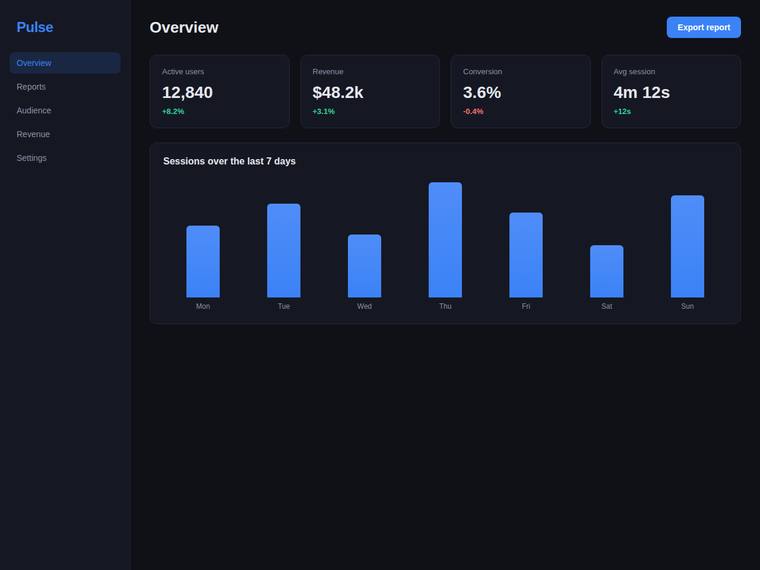
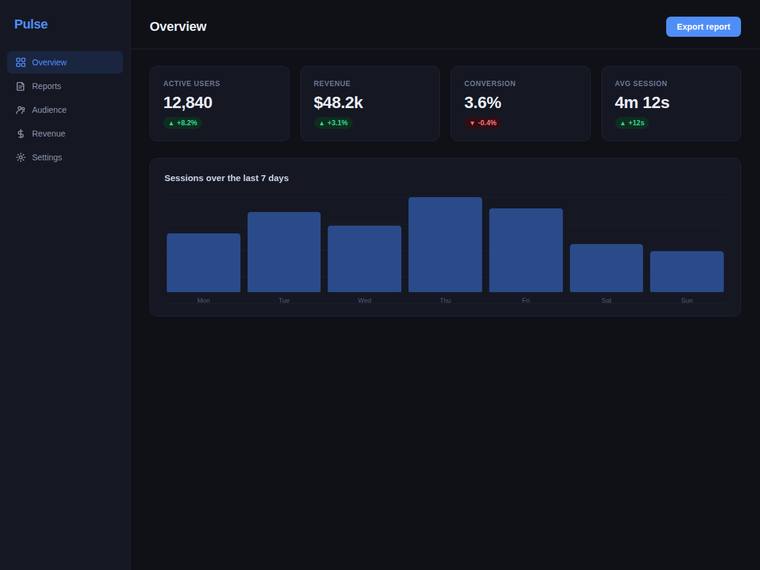
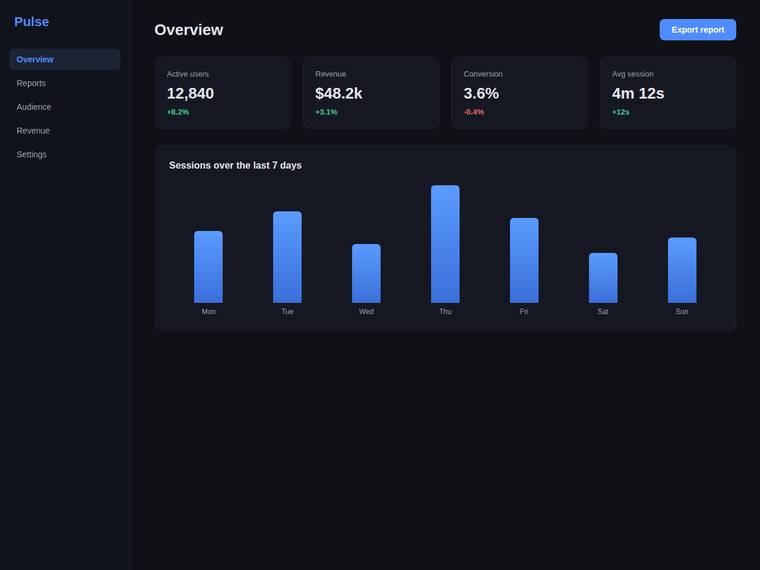
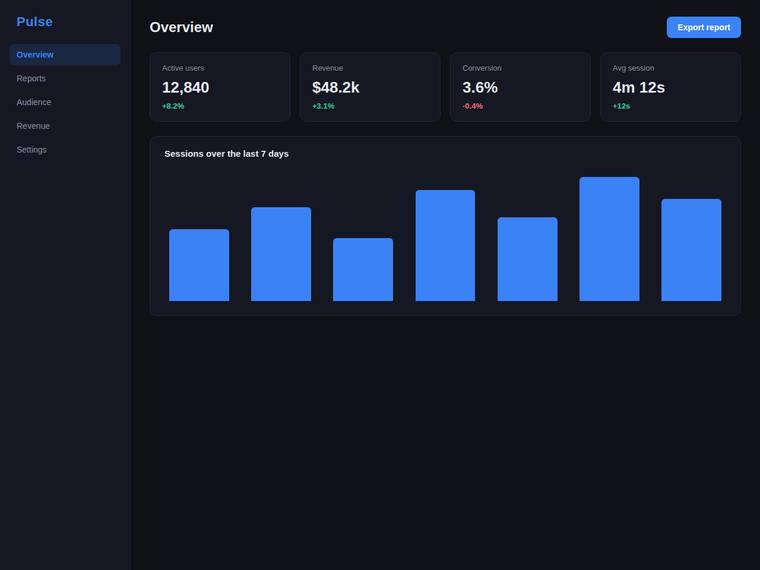
Reproduce a dark analytics dashboard overview from its screenshot
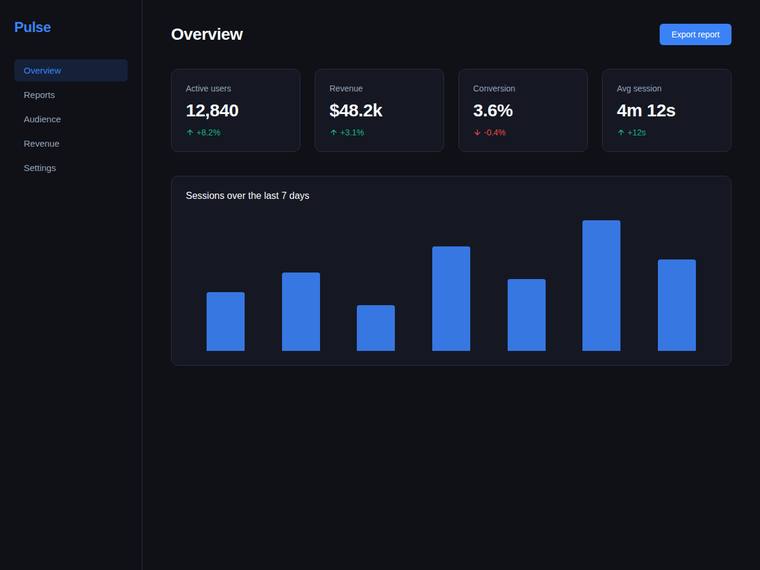
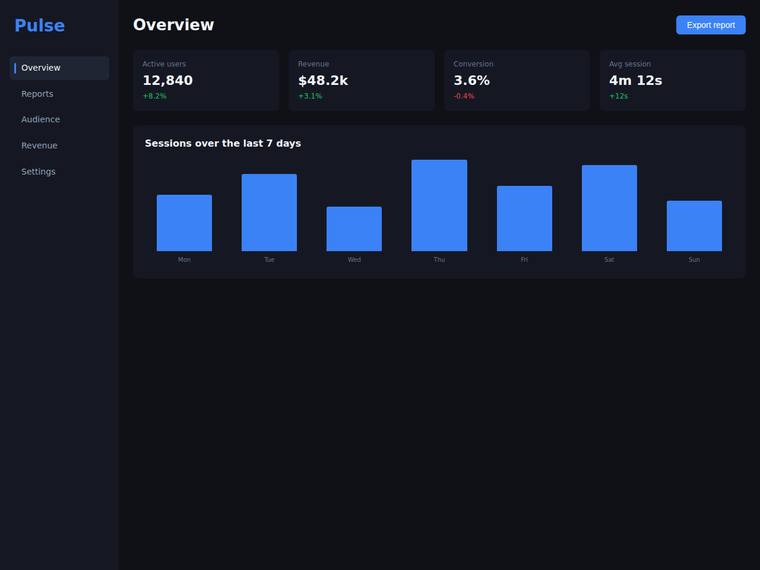
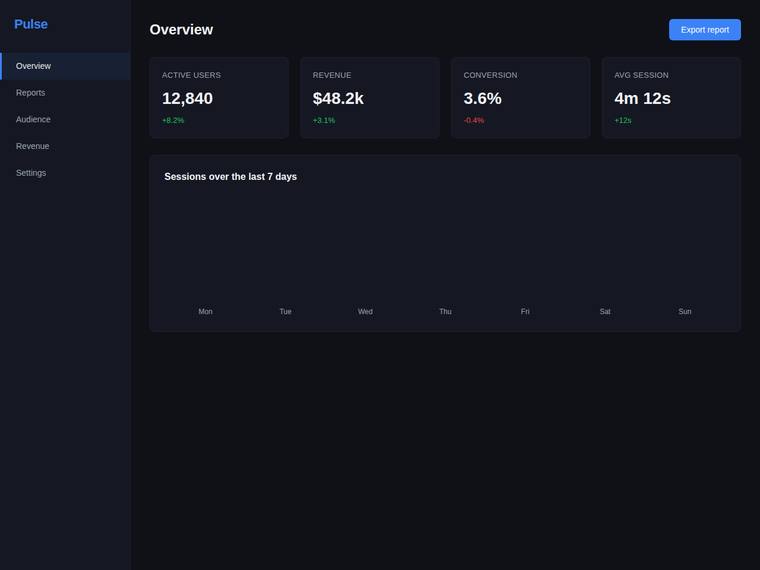
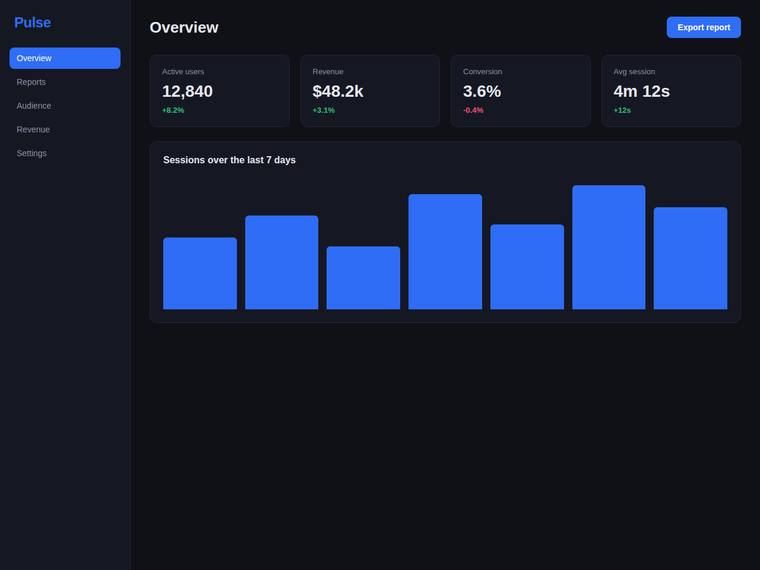
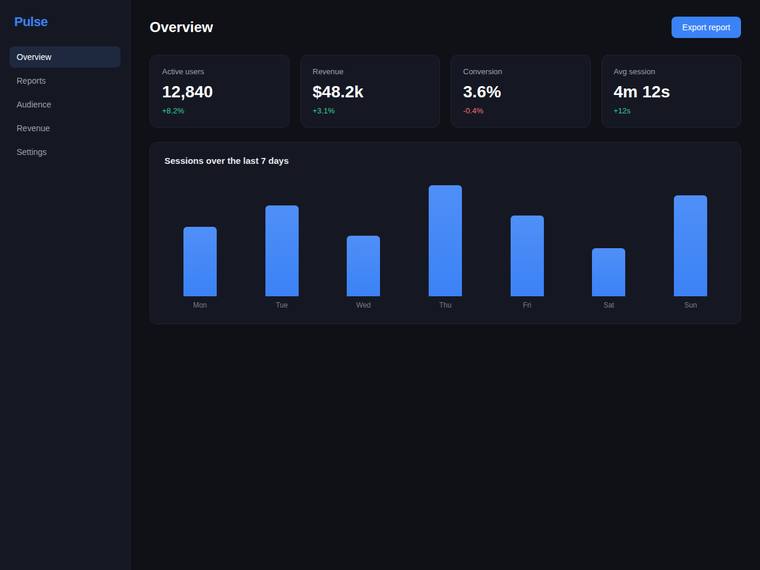
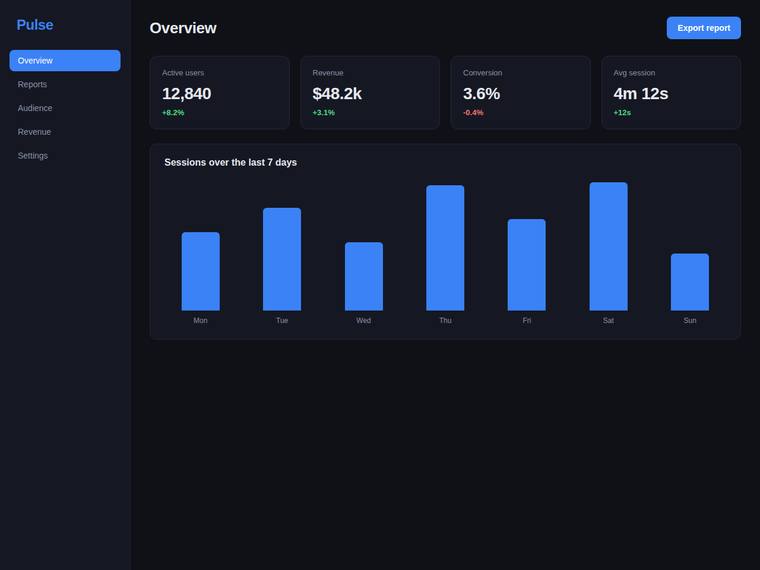
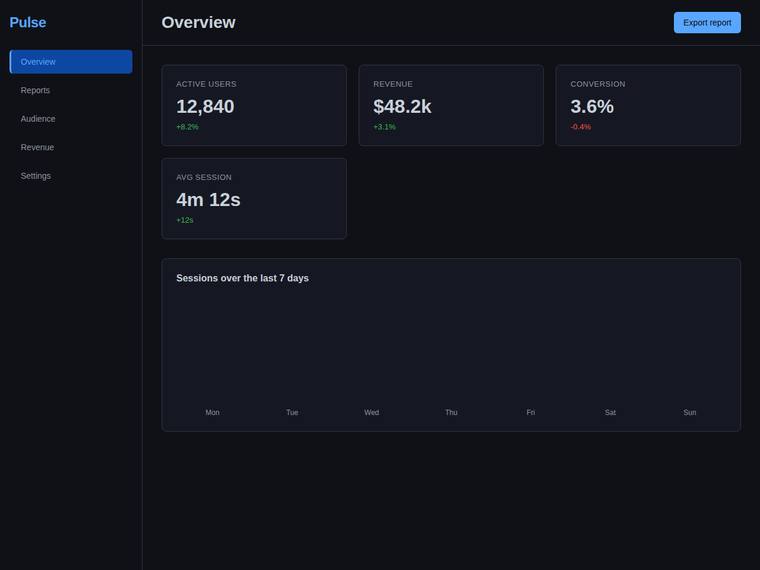
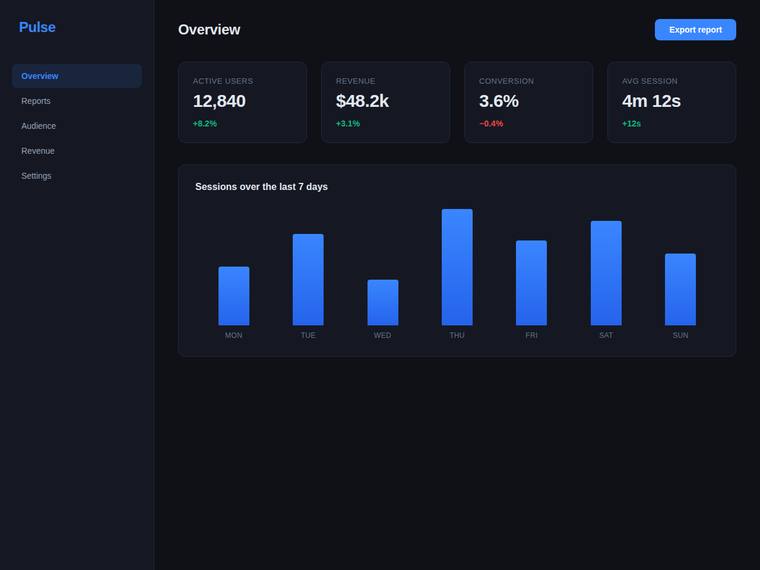
The same task, run on 27 models. Compare the outputs side by side, or open any one in a popup to inspect it.
Top result: grok-composer-2.5-fast (default reasoning) at 99.9% composite. Lowest: deepseek-v4-flash at 0.0%. 27 models compared on this task.
How it ran
- Each model was given the brief below in a fresh, isolated session with no access to our tools, and returned a single self-contained index.html (inline CSS and JS, no external requests, no build step).
- The rendered output was scored 1 to 5 on brief fidelity, visual design, craft, and impact by a four-family vision panel - Anthropic (Claude Opus 4.8), OpenAI (GPT-5.5), Google (Gemini 3.1 Pro), and xAI (Grok 4.3) - using one identical prompt so the scores compare. The published judge score is leave-one-family-out: a model is never scored by a judge of its own family, so same-family self-preference is removed.
The brief
You are given a reference screenshot of an analytics dashboard overview page. Reproduce it as faithfully as you can as ONE self-contained HTML file (`index.html`) that renders with no build step and no network calls (inline all CSS, no external fonts, scripts, or images). Match what the screenshot shows: - a dark theme (near-black page around #0f1117, slightly lighter panels around #151823), - a fixed left sidebar with the blue "Pulse" word-mark and a vertical nav: Overview (the active item), Reports, Audience, Revenue, Settings, - a main area with a top bar: an "Overview" heading on the left and a blue "Export report" button on the right, - a row of four KPI stat cards: Active users 12,840 (+8.2%), Revenue $48.2k (+3.1%), Conversion 3.6% (-0.4%, shown in red), and Avg session 4m 12s (+12s), - below the cards, a panel titled "Sessions over the last 7 days" containing a simple bar chart of seven blue bars of varying heights. Keep the dark colours, the sidebar-plus-content layout, the four-up stat grid, and the relative sizing close to the screenshot. The layout must stay readable when the window is narrowed (the stat grid should reflow, not overflow).