Banja Lab / Benchmarks / Test
DIAGR-0006SVG and graphics · hard
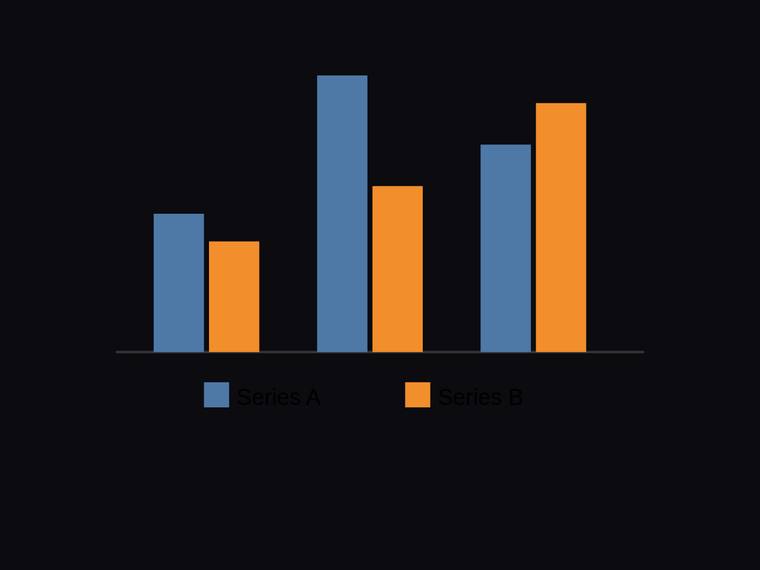
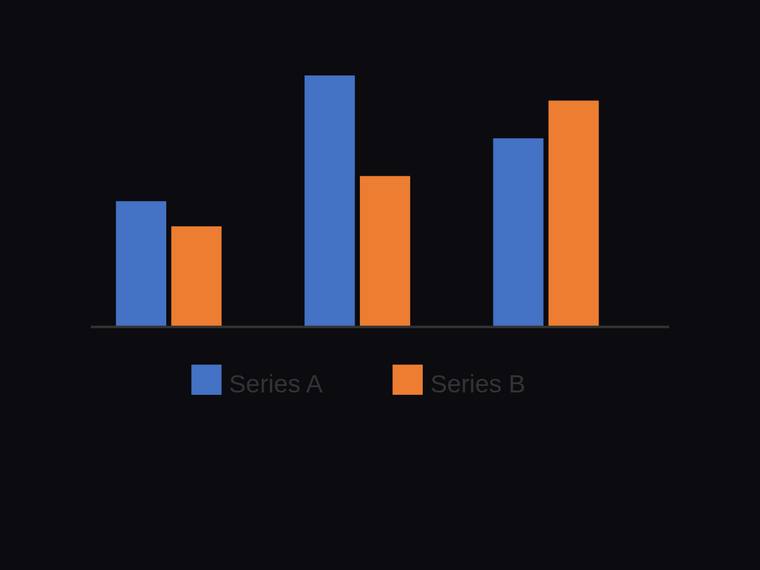
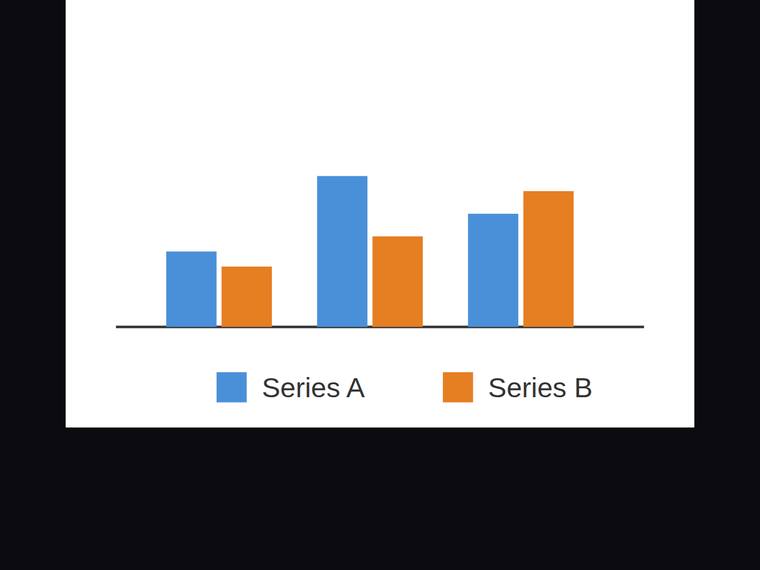
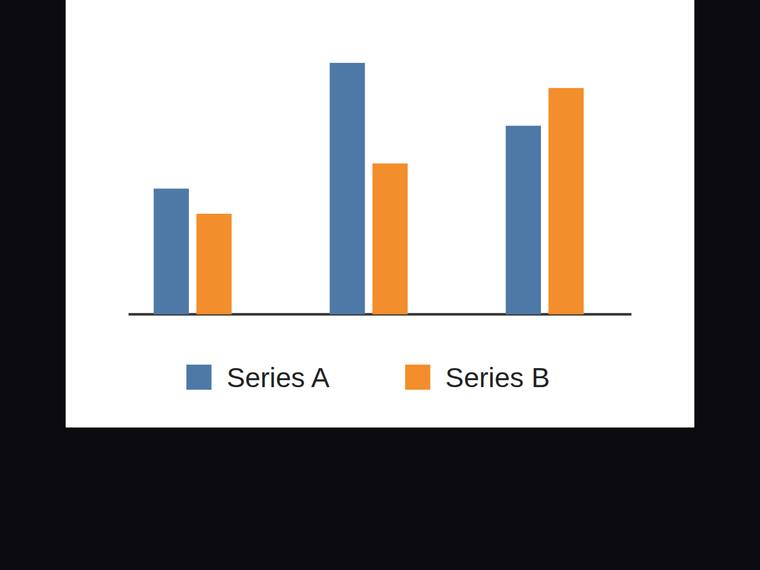
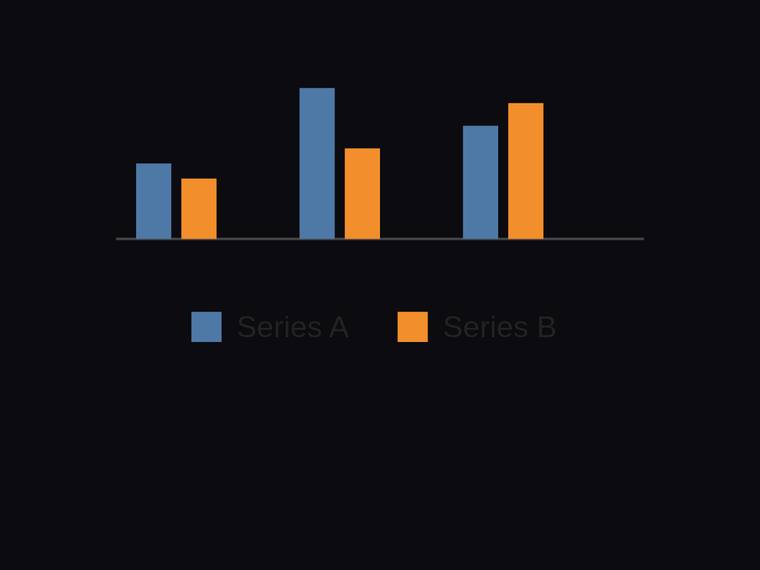
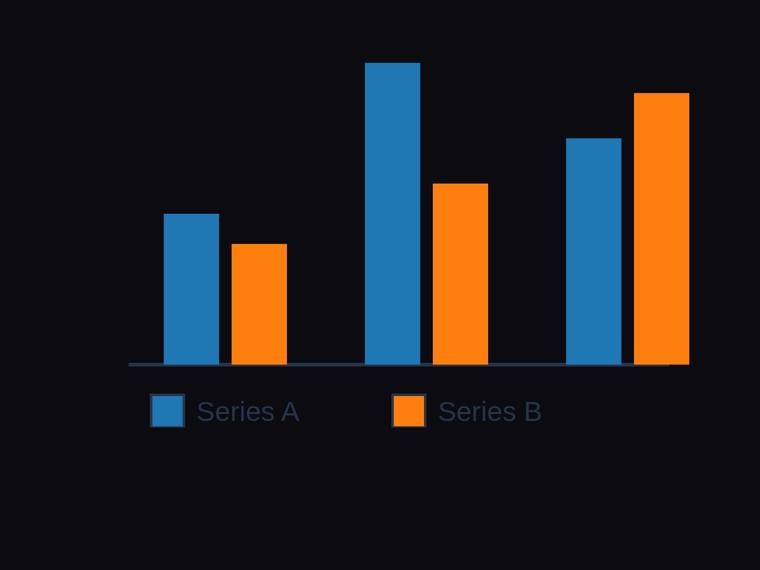
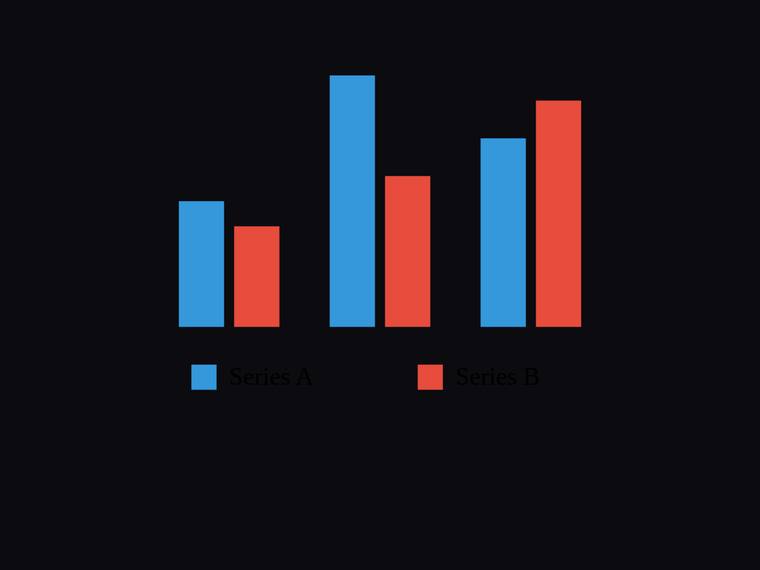
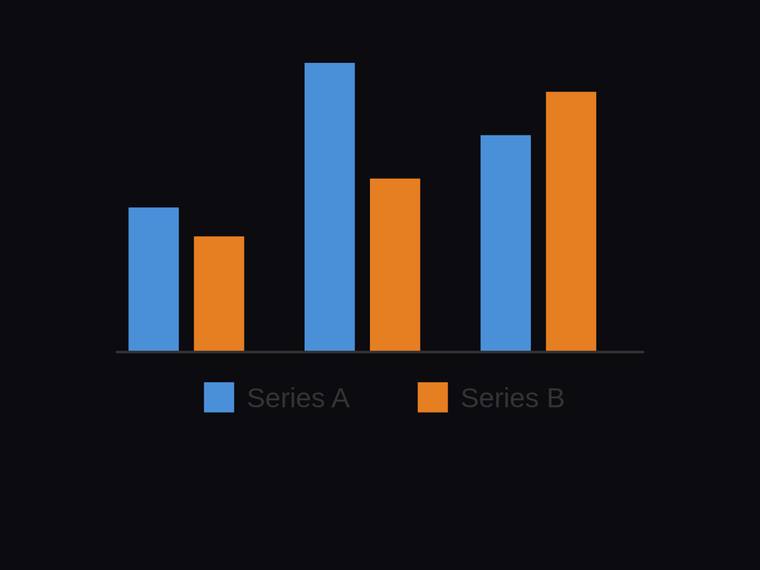
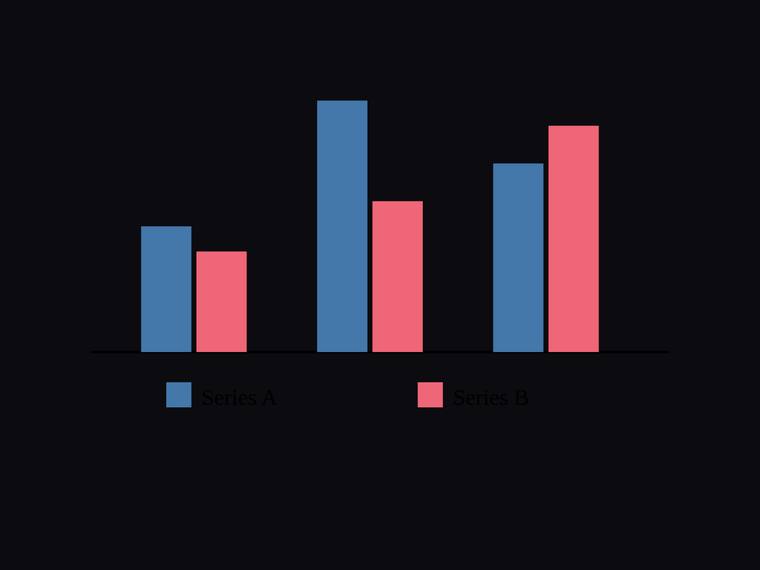
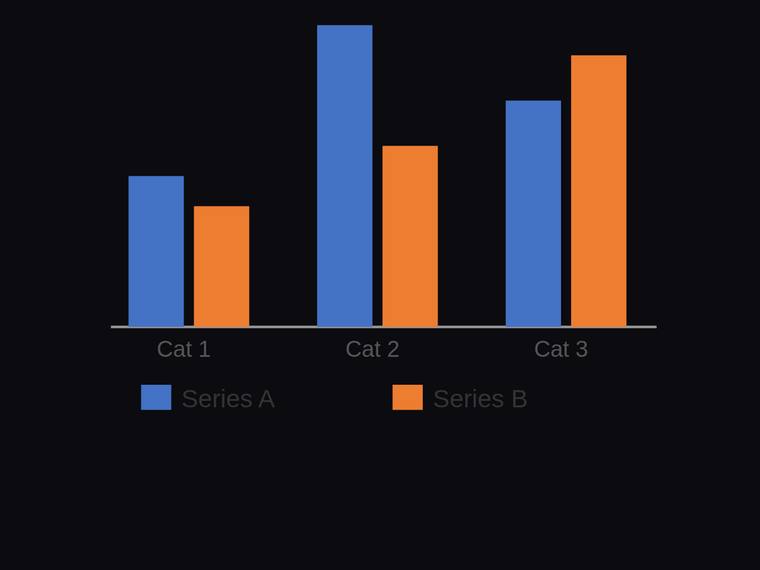
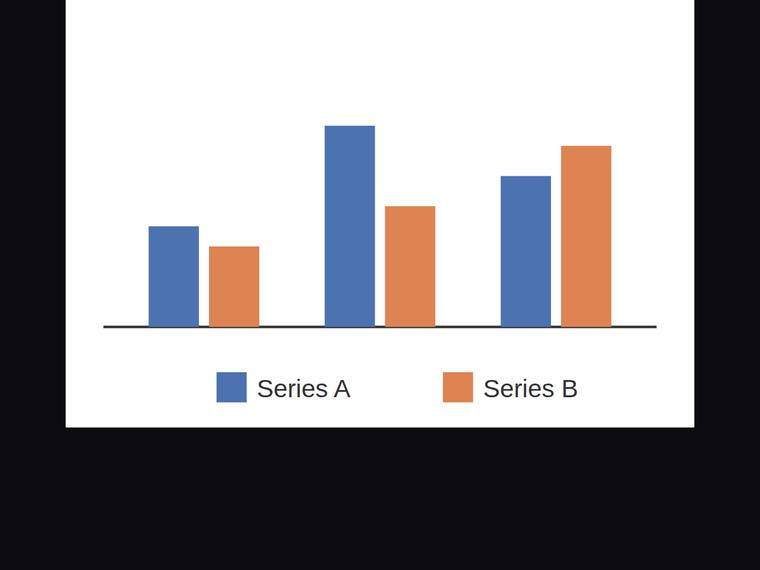
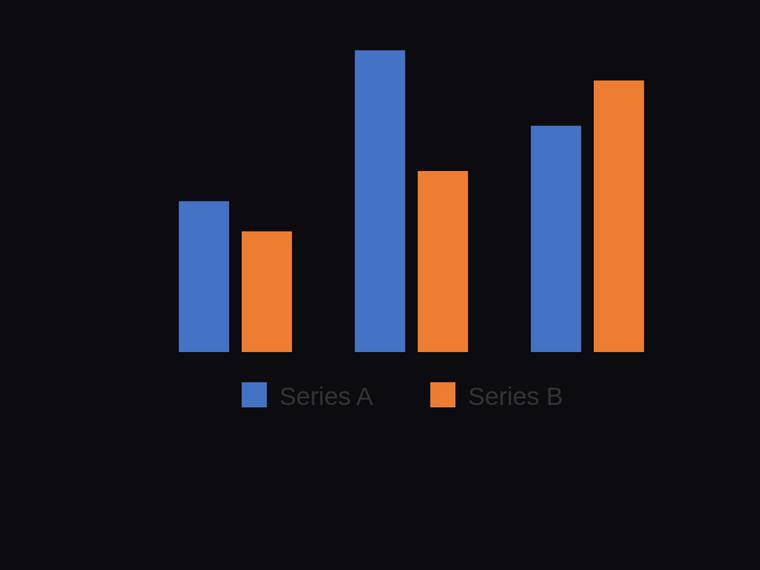
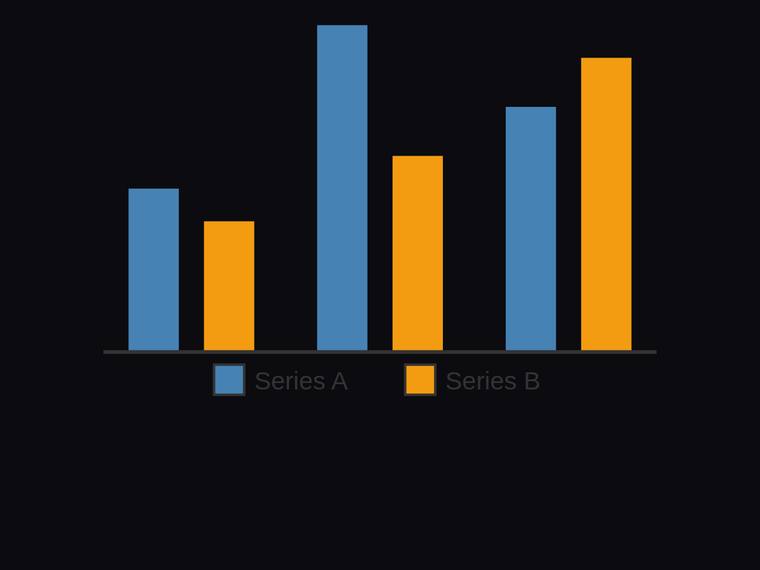
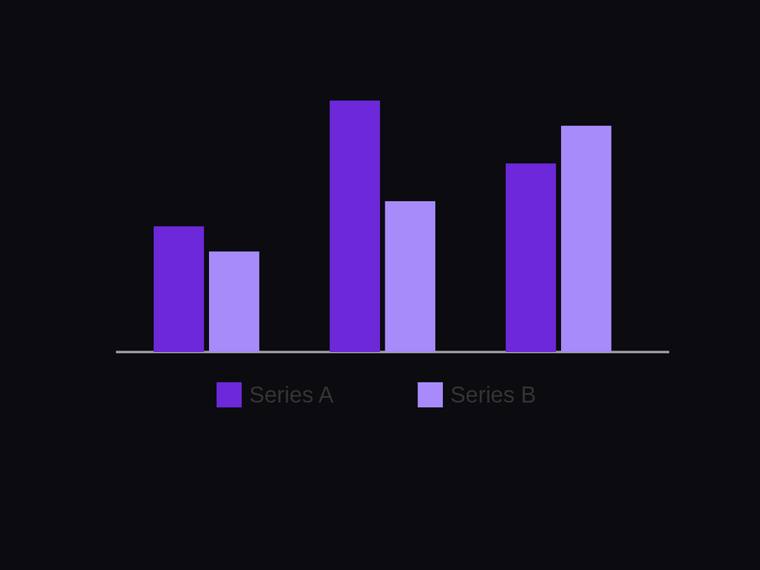
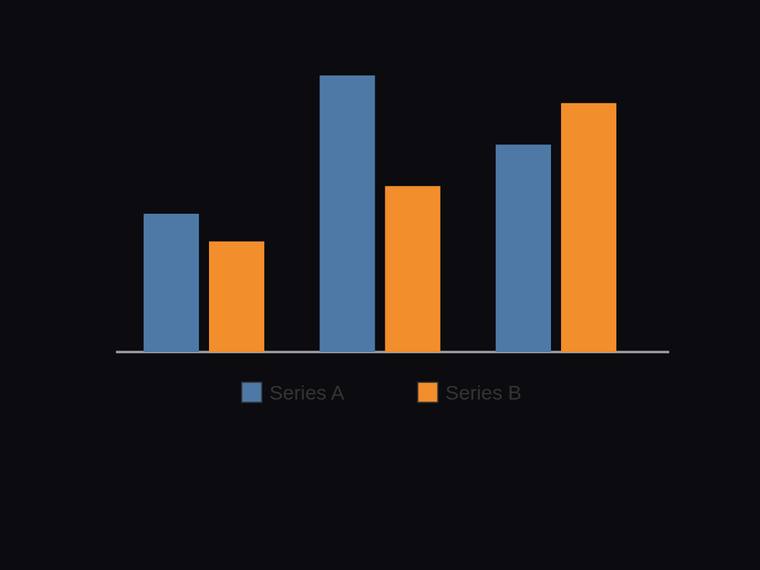
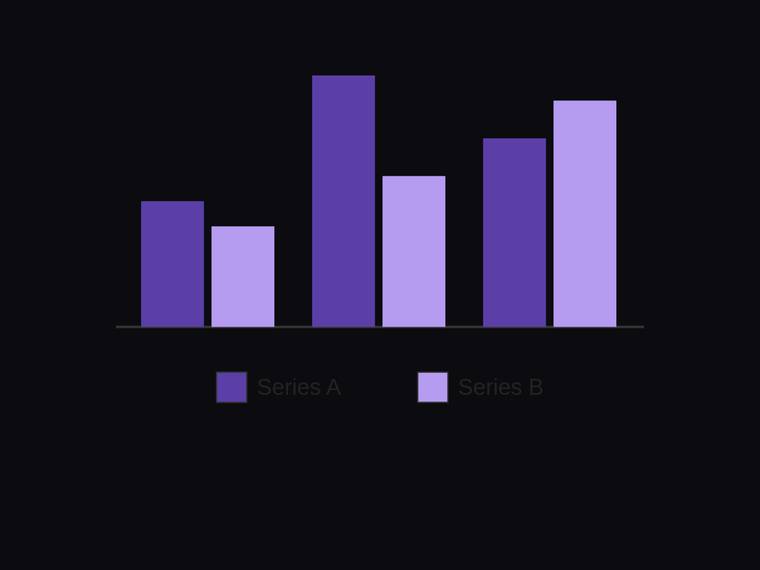
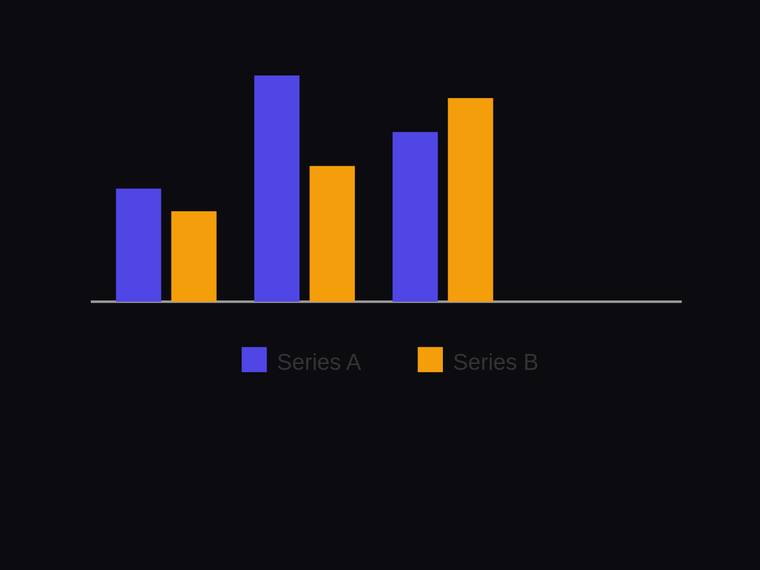
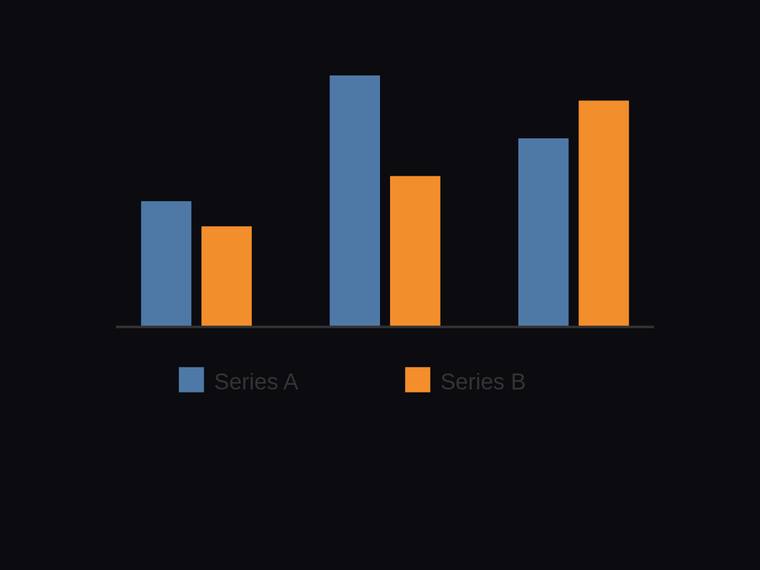
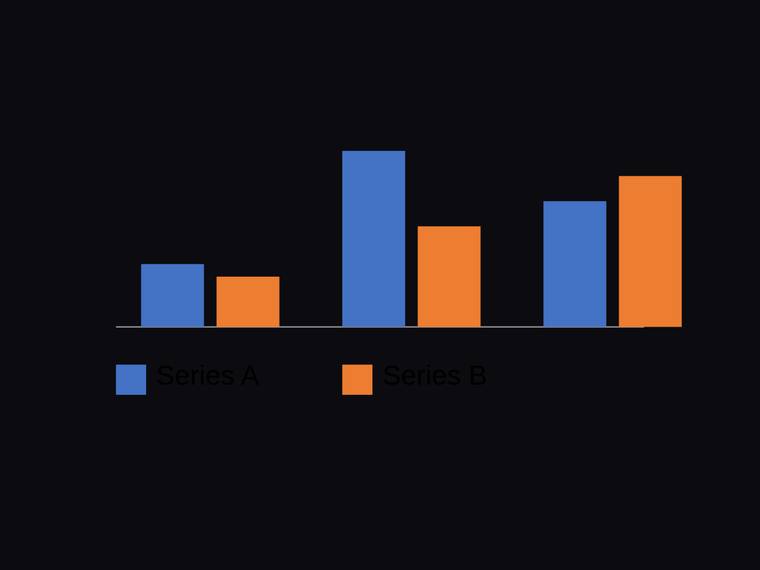
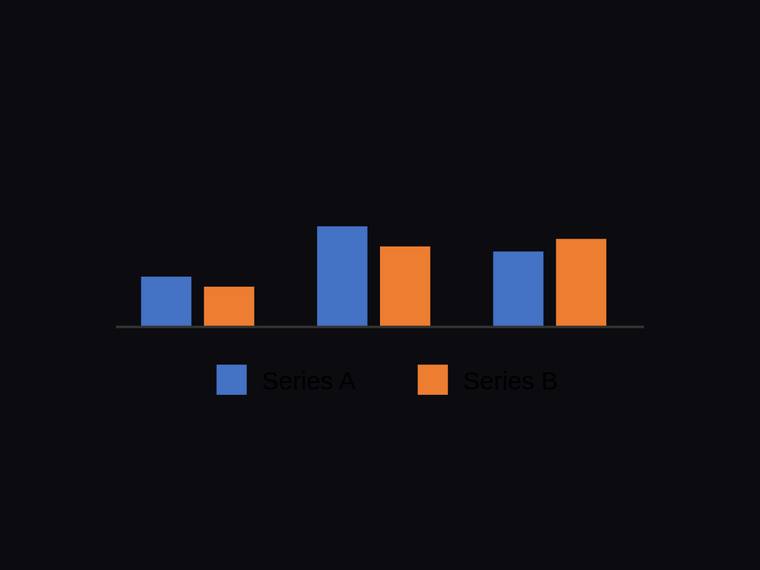
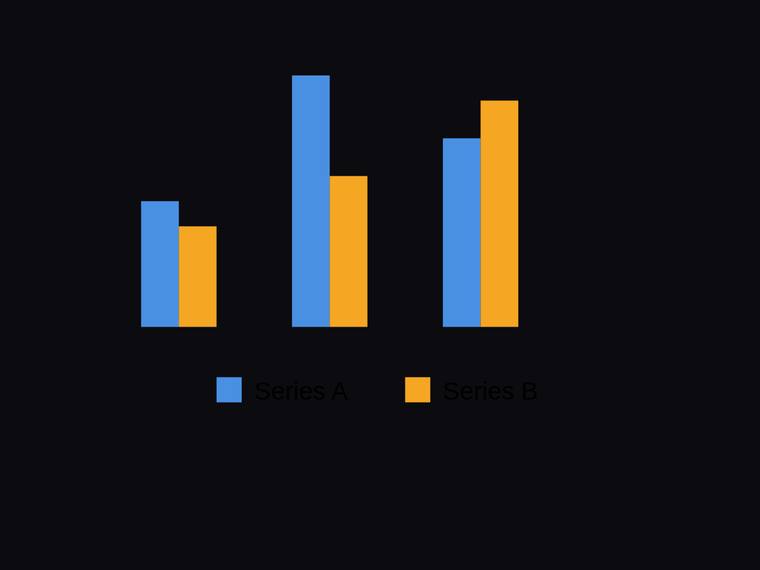
Grouped two-series bar chart across three categories with a legend
The same task, run on 27 models. Compare the outputs side by side, or open any one in a popup to inspect it.
Top result: claude-opus-4-8 (low reasoning) at 100.0% composite. Lowest: claude-haiku-4-5 at 0.4%. 27 models compared on this task.
How it ran
- Each model was given the brief below in a fresh, isolated session with no access to our tools, and returned its answer from scratch.
- The rendered output was scored 1 to 5 on brief fidelity, visual design, craft, and impact by a four-family vision panel - Anthropic (Claude Opus 4.8), OpenAI (GPT-5.5), Google (Gemini 3.1 Pro), and xAI (Grok 4.3) - using one identical prompt so the scores compare. The published judge score is leave-one-family-out: a model is never scored by a judge of its own family, so same-family self-preference is removed.
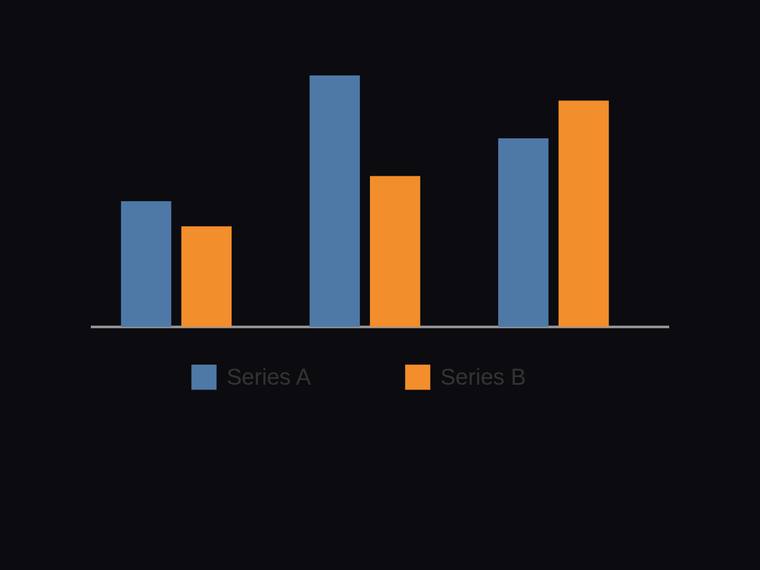
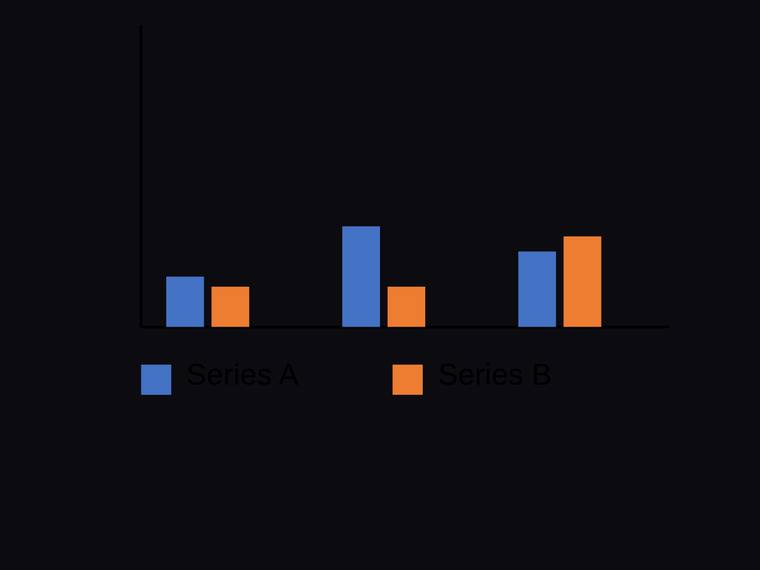
The brief
Draw a grouped (clustered) bar chart in SVG using a 250x170 viewBox. Write it to `chart.svg`. There are three categories, and each category shows two bars side by side: a Series A bar and a Series B bar. Each bar is a `<rect>` carrying class "series-a" or "series-b" and the listed id. Within each category the Series A bar is to the left of the Series B bar. Series A values (ids a1, a2, a3): [10, 20, 15] - heights proportional to these. Series B values (ids b1, b2, b3): [8, 12, 18] - heights proportional to these. All bars sit on a shared baseline near the bottom. Categories run left to right in the order a1/b1, then a2/b2, then a3/b3 (so a1 is left of a2 is left of a3). Add a legend below the chart: two `<rect class="swatch">` swatches and two `<text>` labels reading Series A and Series B. Requirements: - Exactly three series-a bars and three series-b bars. - Within each category, the series-a bar is left of the series-b bar. - Exactly two legend swatches; both legend labels present. - Vector primitives only: no raster images, no data: URIs, no base64, no <foreignObject>, no <script>, no external references.