Banja Lab / Benchmarks / Test
DIAGR-0005SVG and graphics · hard
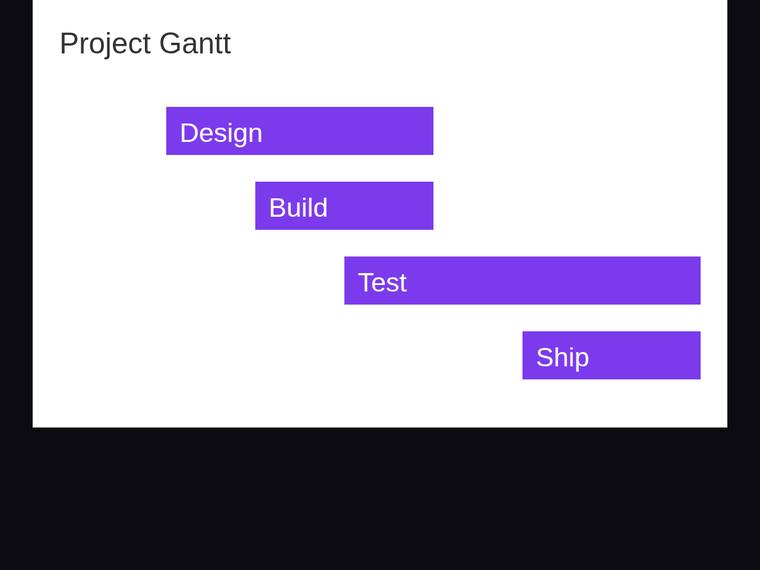
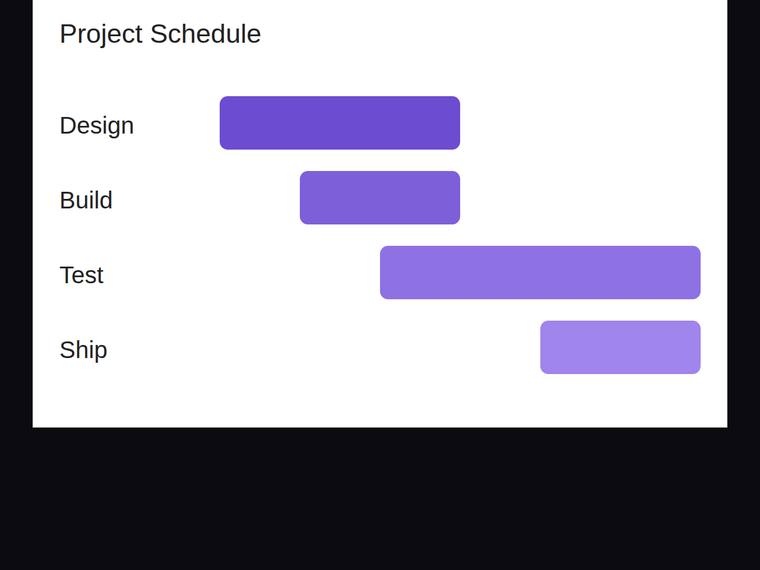
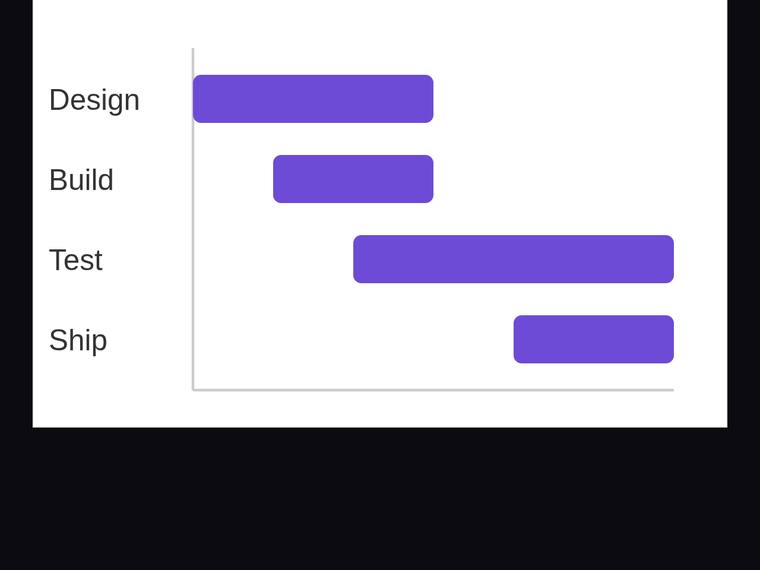
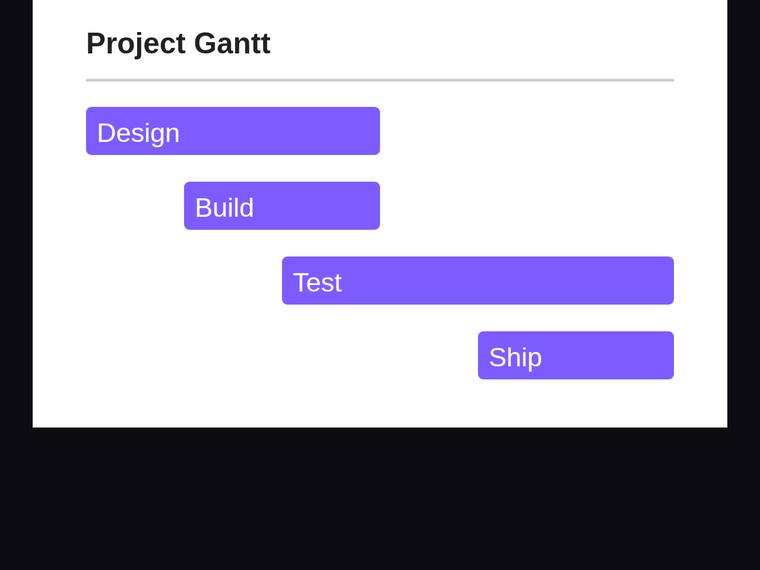
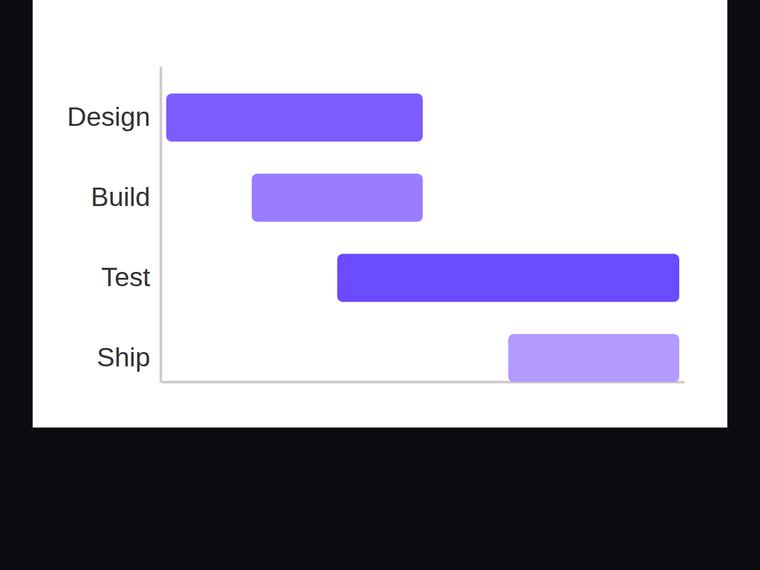
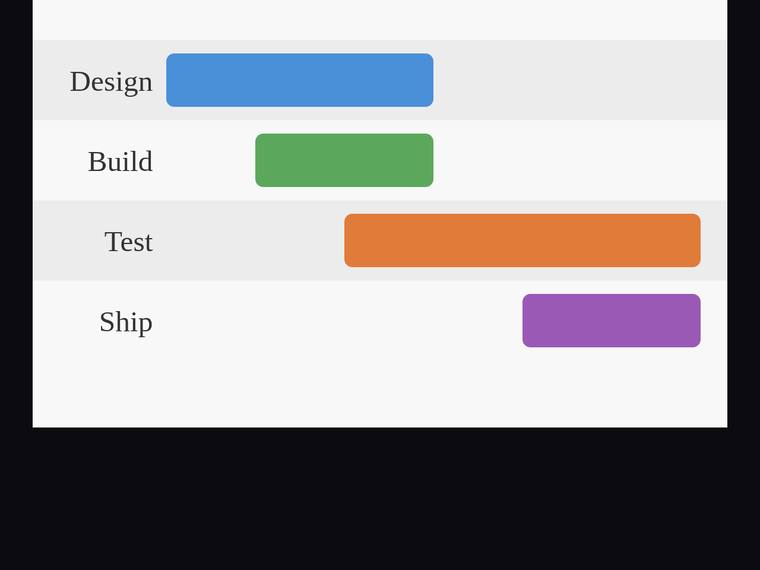
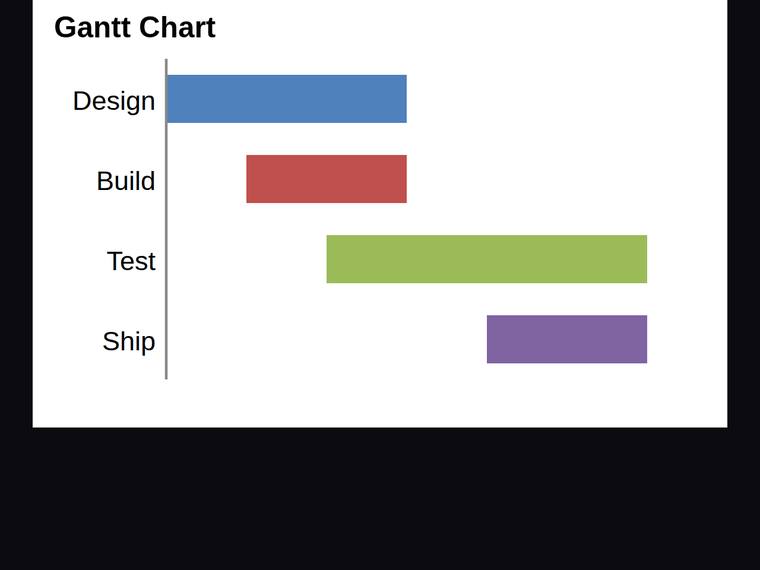
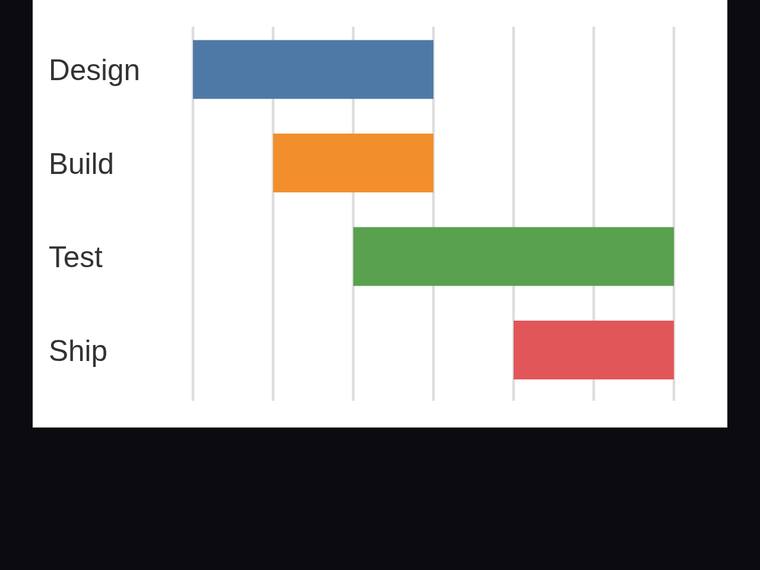
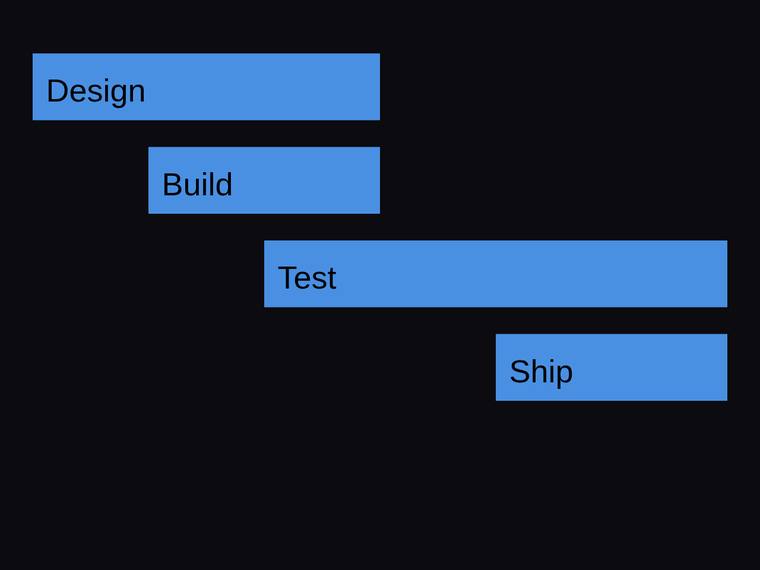
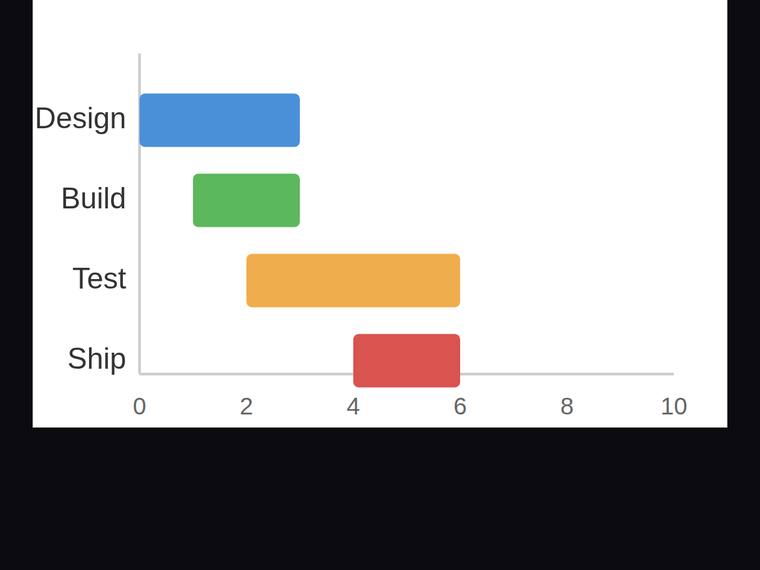
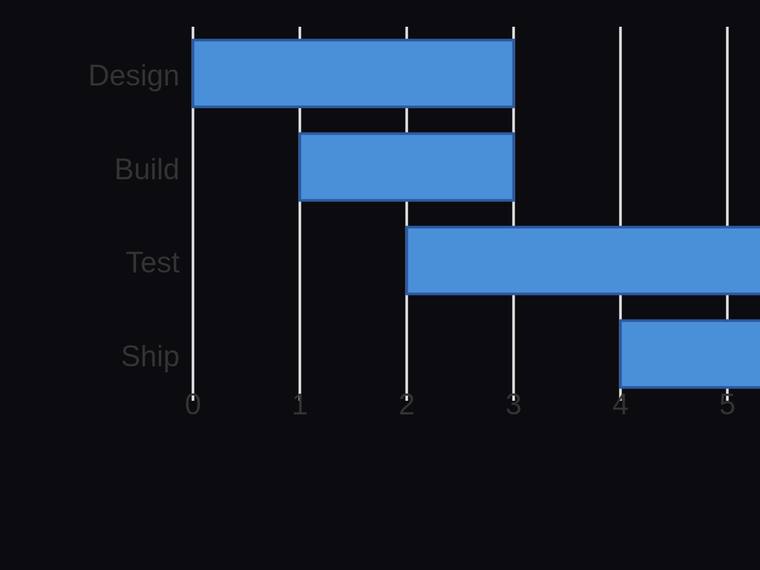
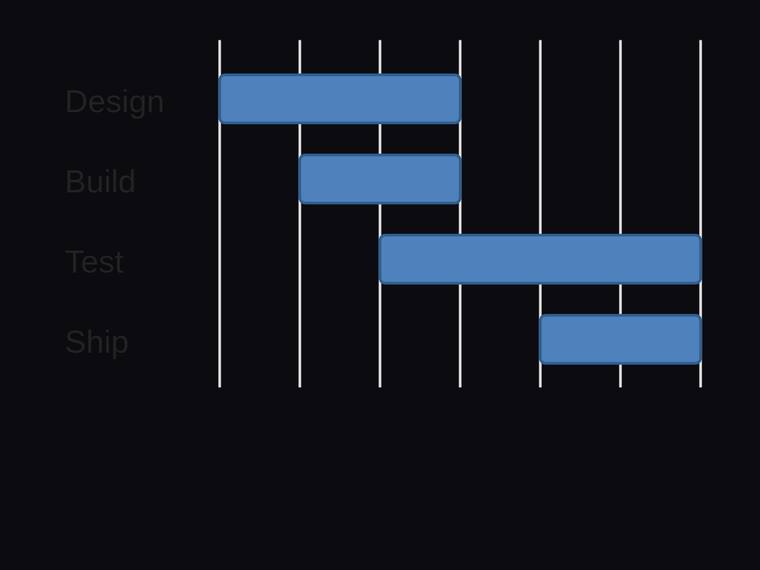
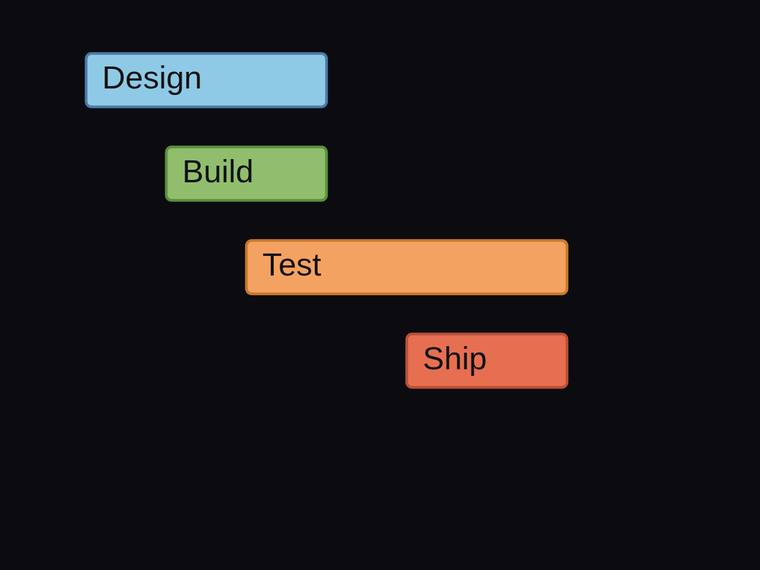
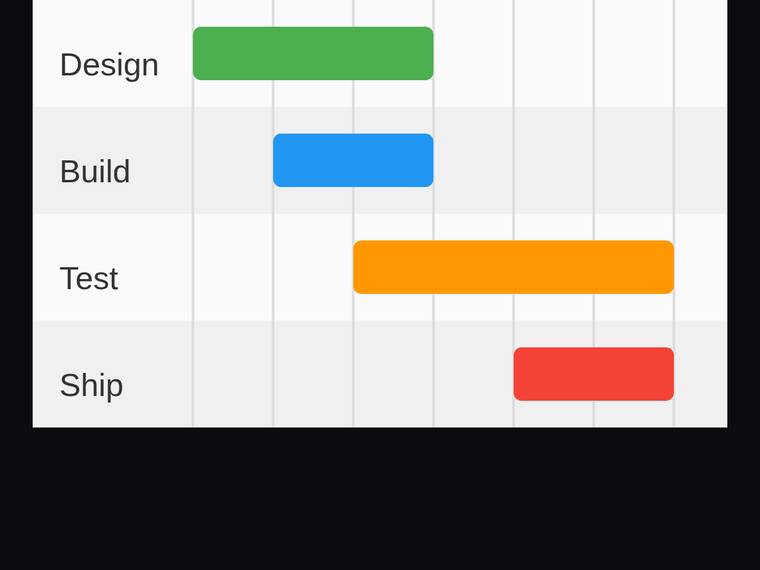
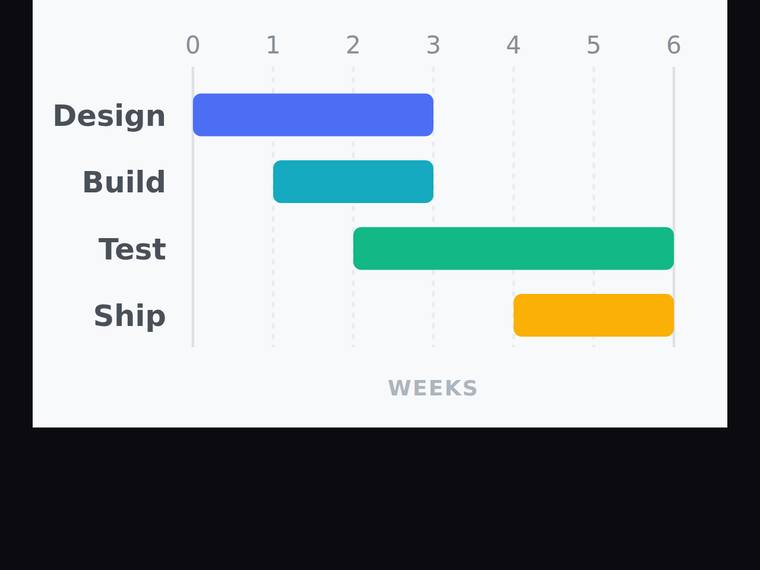
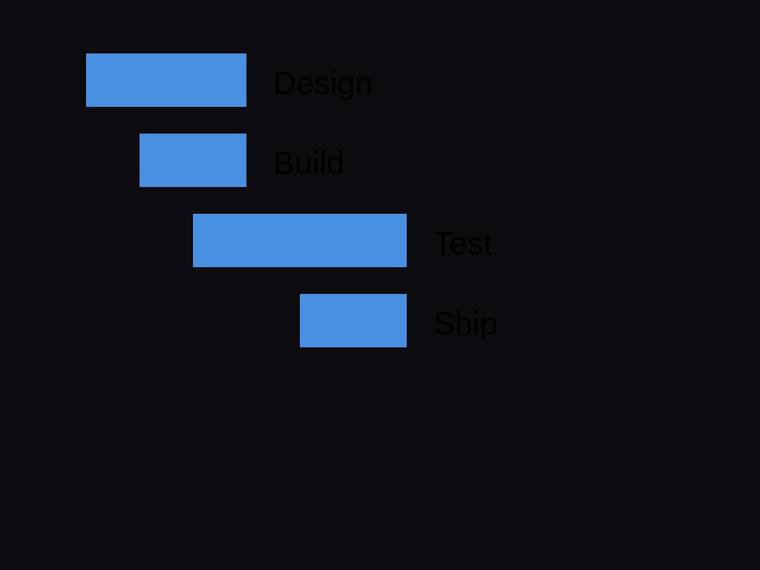
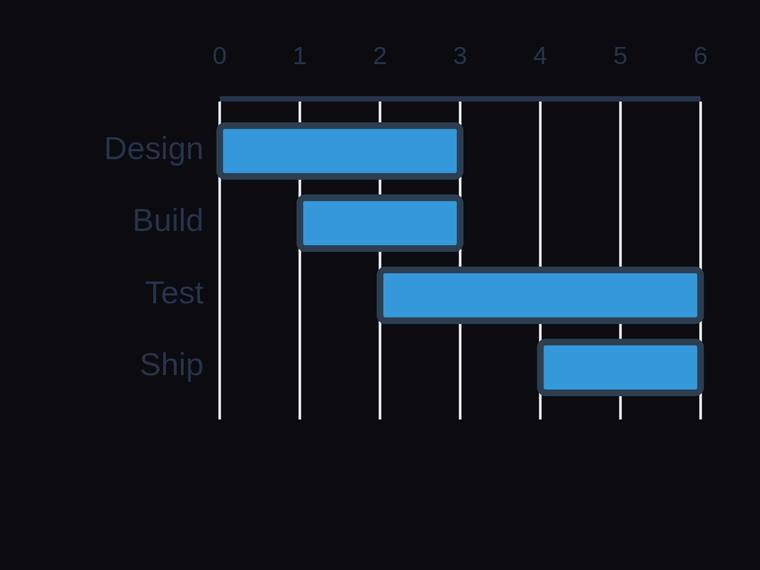
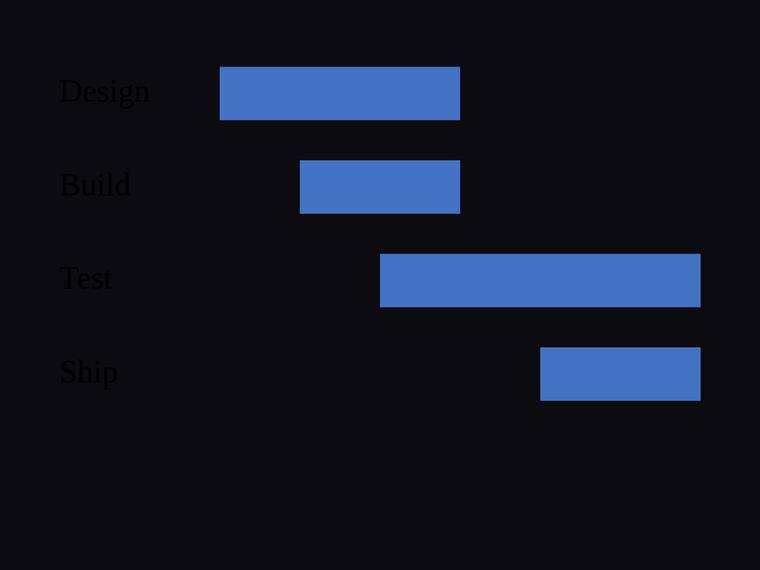
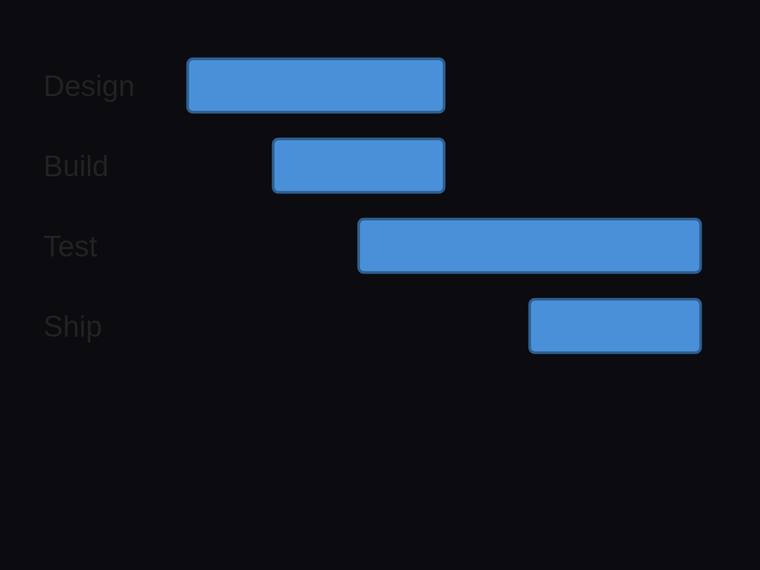
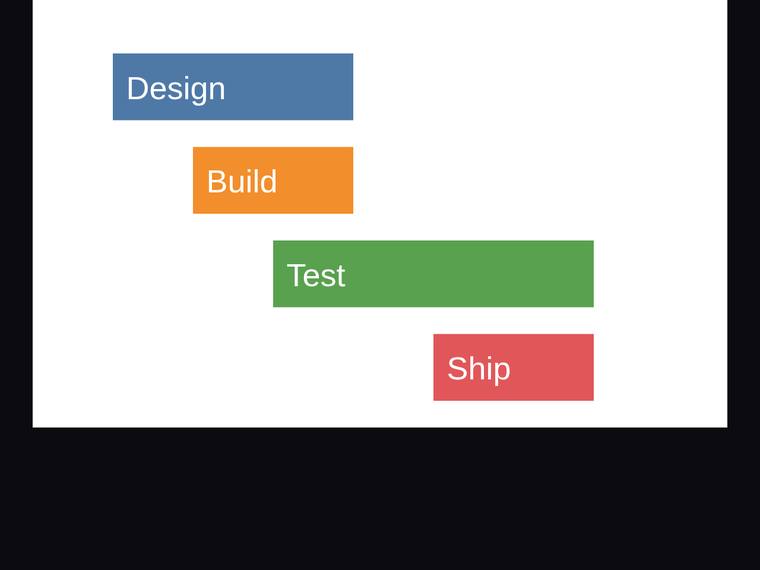
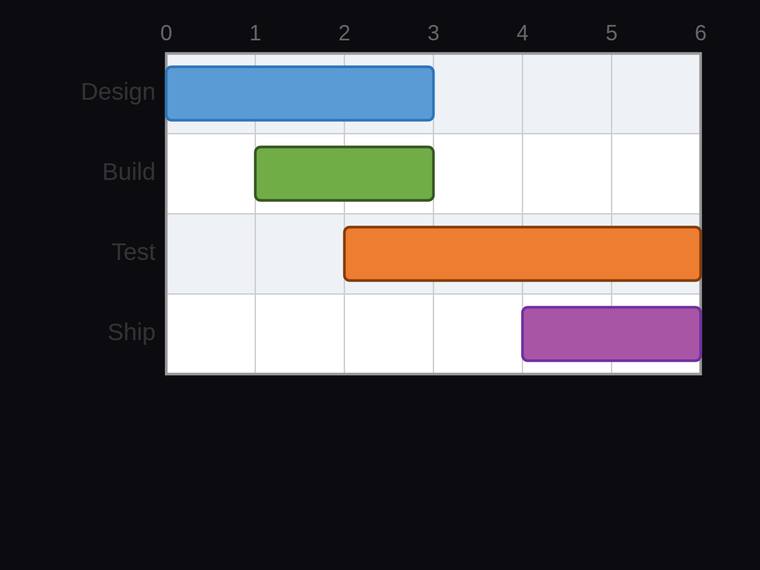
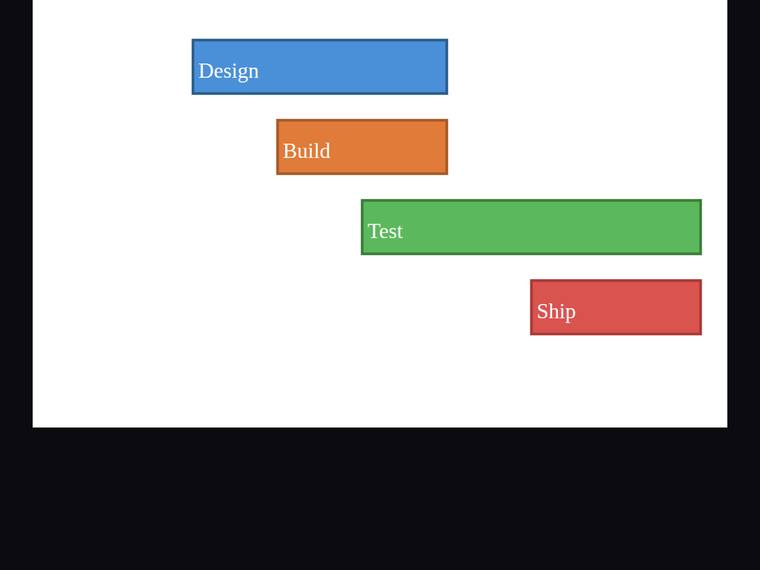
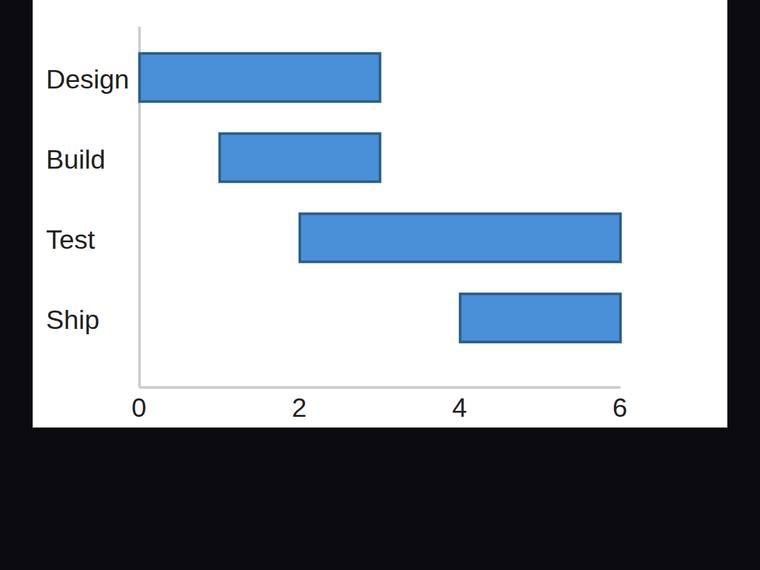
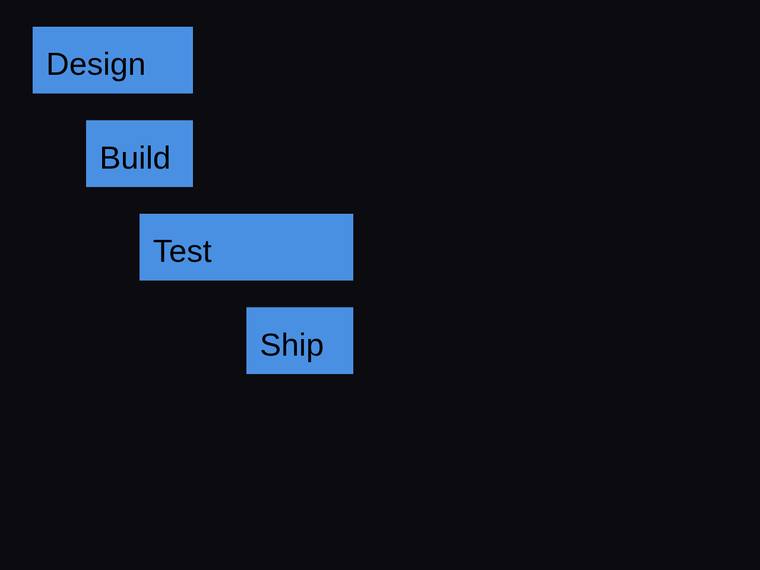
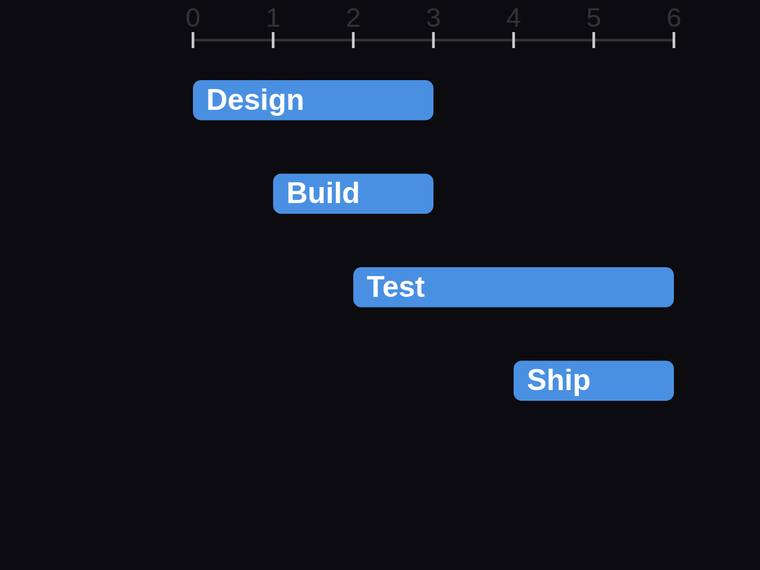
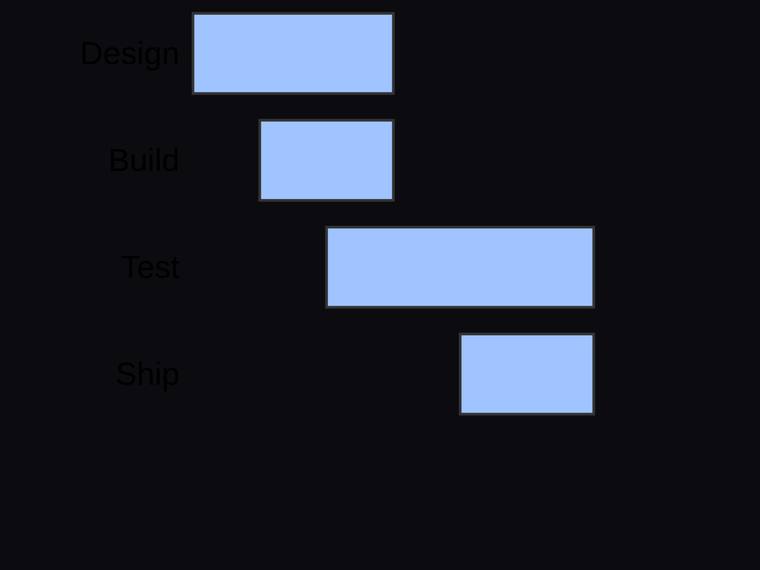
Gantt chart with proportional start offsets and durations
The same task, run on 27 models. Compare the outputs side by side, or open any one in a popup to inspect it.
Top result: claude-opus-4-8 (low reasoning) at 100.0% composite. Lowest: deepseek-v4-flash at 100.0%. 27 models compared on this task.
How it ran
- Each model was given the brief below in a fresh, isolated session with no access to our tools, and returned its answer from scratch.
- The rendered output was scored 1 to 5 on brief fidelity, visual design, craft, and impact by a four-family vision panel - Anthropic (Claude Opus 4.8), OpenAI (GPT-5.5), Google (Gemini 3.1 Pro), and xAI (Grok 4.3) - using one identical prompt so the scores compare. The published judge score is leave-one-family-out: a model is never scored by a judge of its own family, so same-family self-preference is removed.
The brief
Draw a Gantt chart in SVG using a 260x160 viewBox. Write it to `chart.svg`. There are four task bars, each a `<rect class="task">` with the listed id, stacked in separate rows. Each bar's horizontal start (its left edge x) is proportional to the task's start week, and each bar's width is proportional to the task's duration in weeks. Tasks (id : label : start week : duration weeks): - t1 : Design : start 0 : duration 3 - t2 : Build : start 1 : duration 2 - t3 : Test : start 2 : duration 4 - t4 : Ship : start 4 : duration 2 So the start-week values map linearly onto the bars' left-edge x positions, and the width ratios match the duration ratios (the Test bar is the widest). Requirements: - Exactly four task bars (class="task"), in id order t1, t2, t3, t4 (document order). - Put each task label (Design, Build, Test, Ship) in a `<text>` element. - Vector primitives only: no raster images, no data: URIs, no base64, no <foreignObject>, no <script>, no external references.