Banja Lab / Benchmarks / Test
DIAGR-0004SVG and graphics · hard
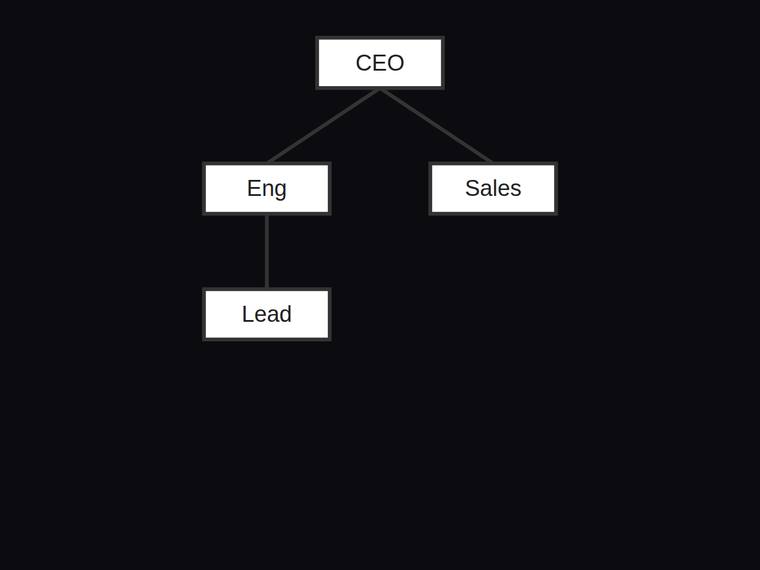
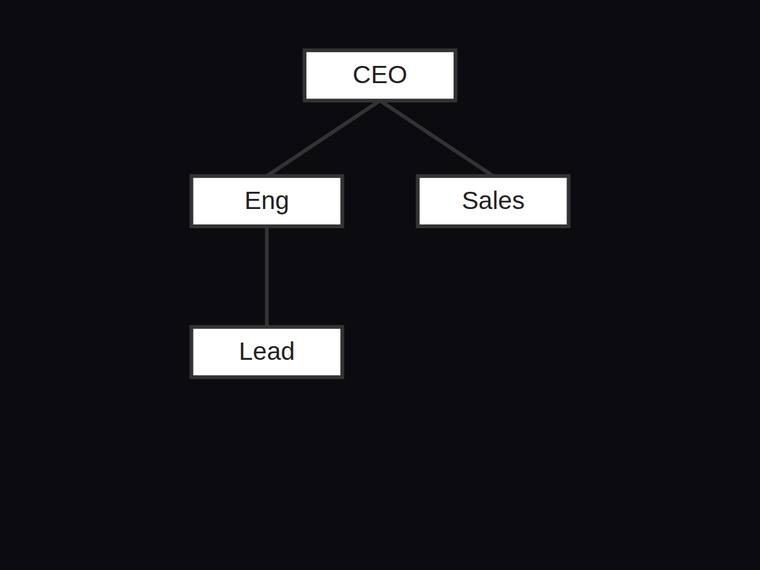
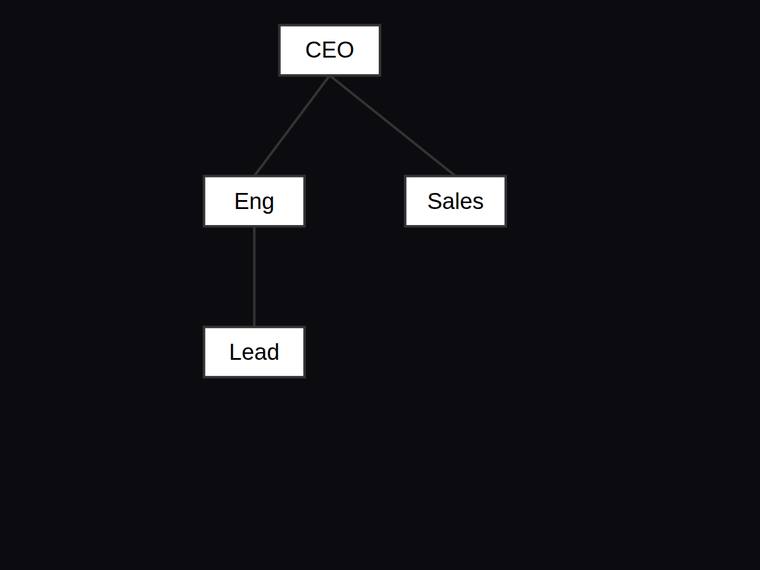
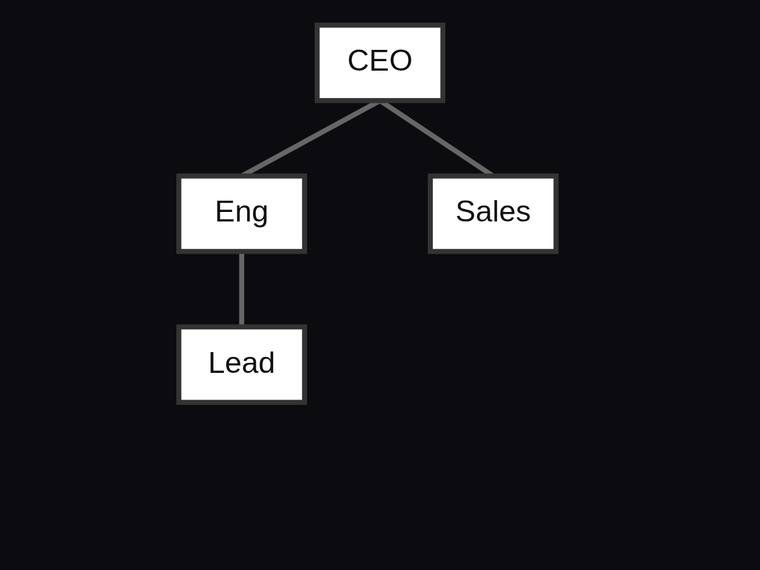
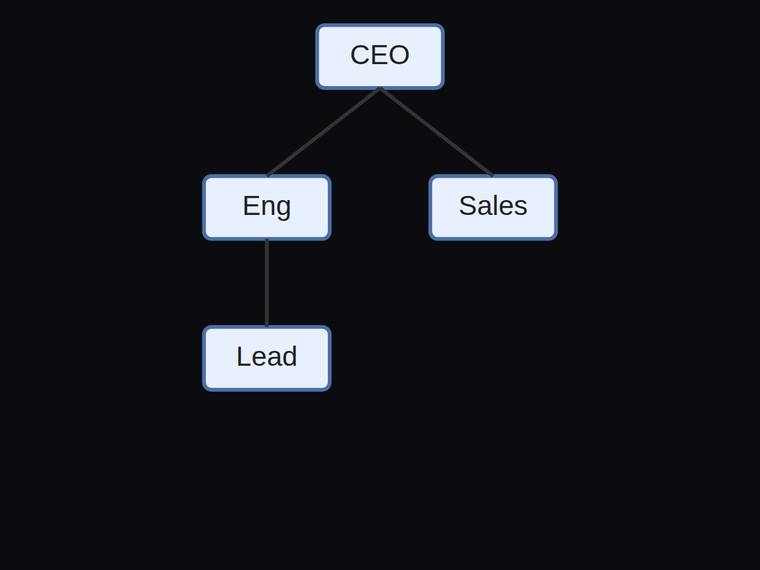
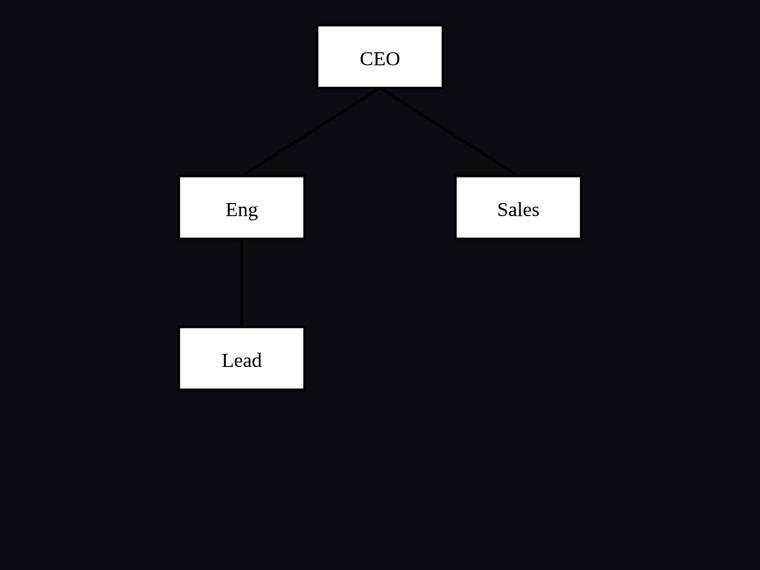
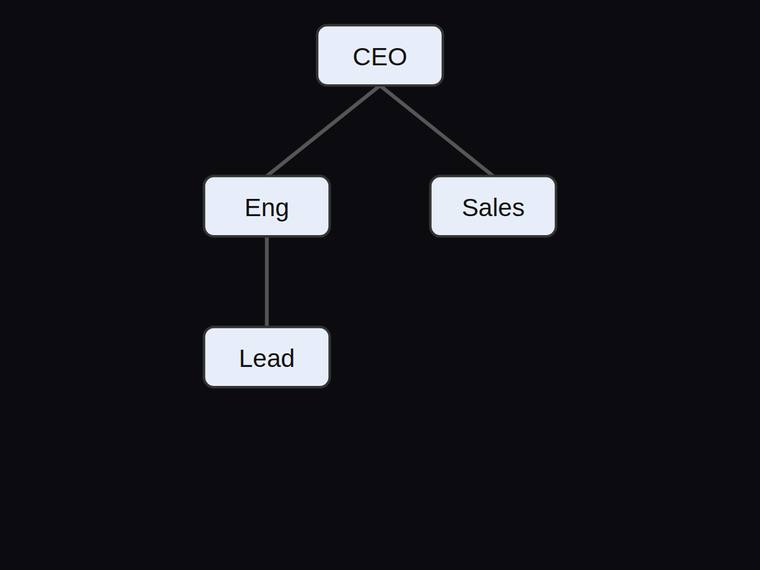
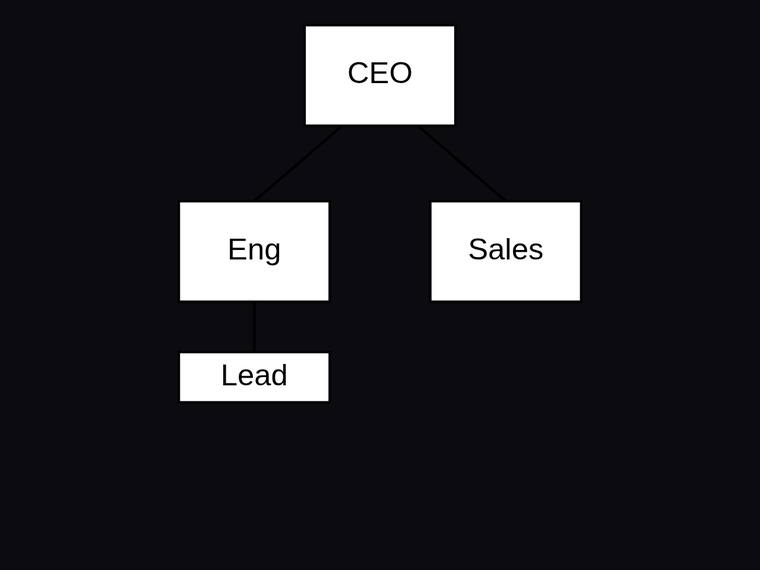
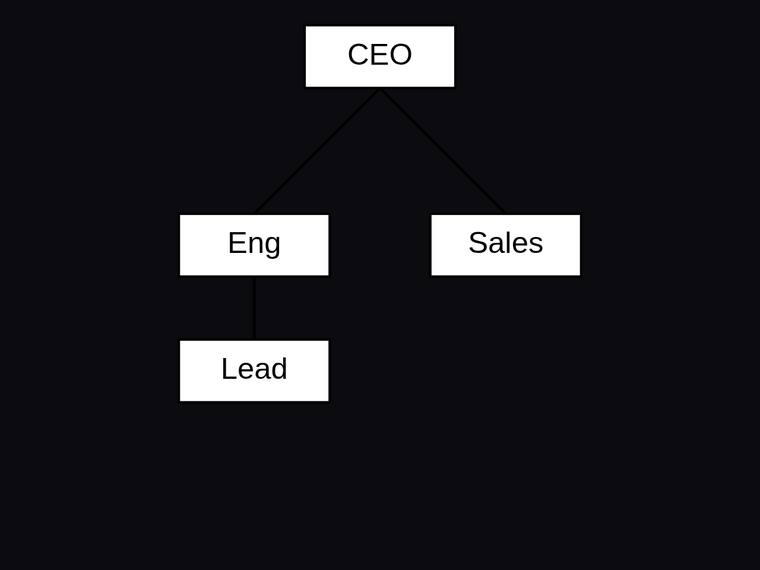
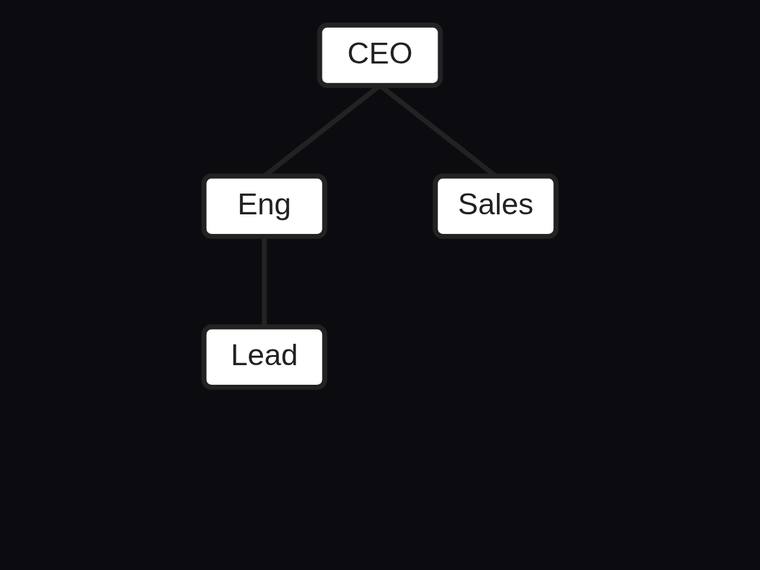
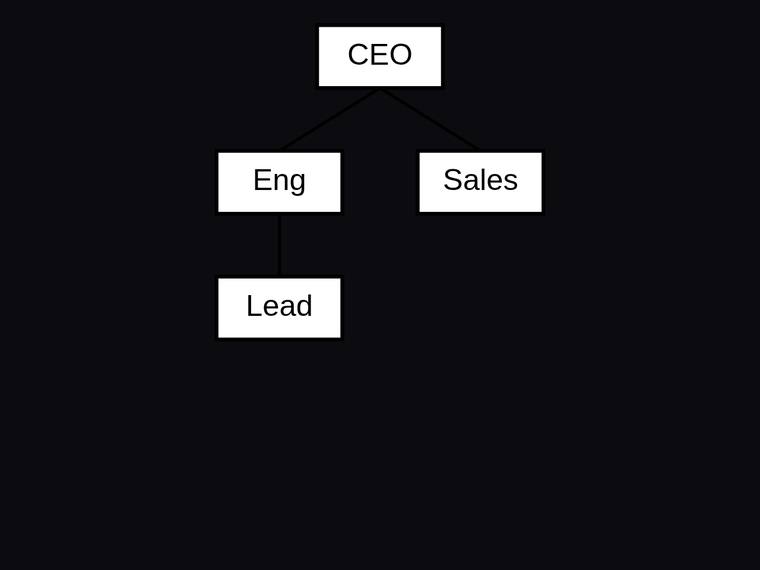
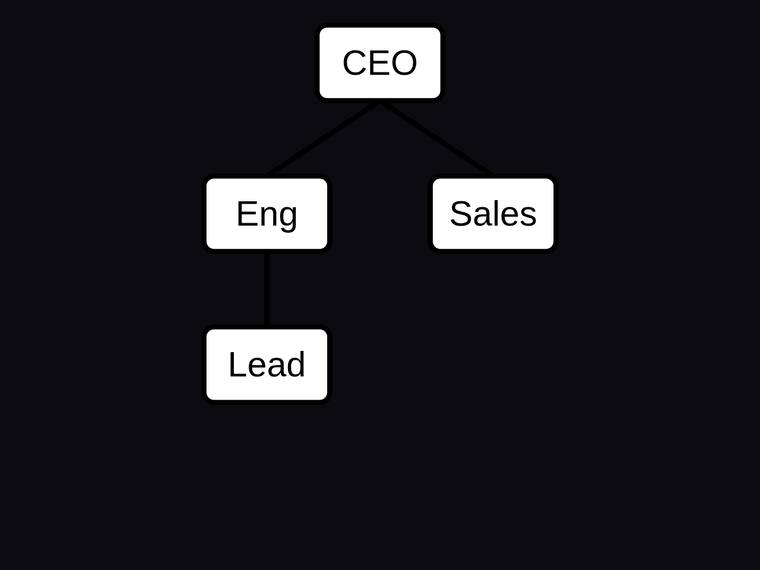
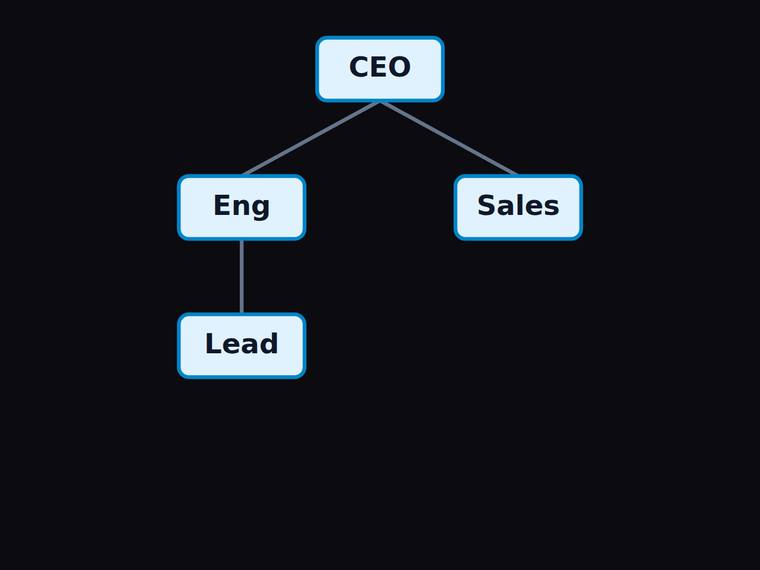
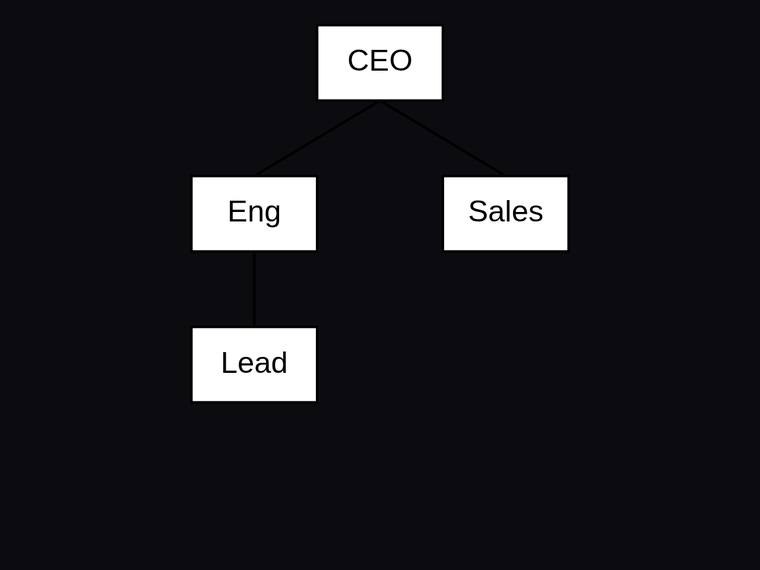
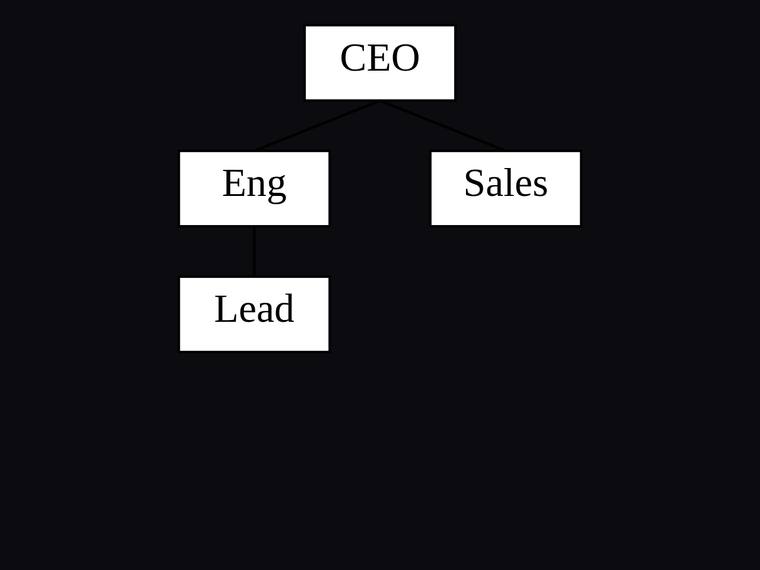
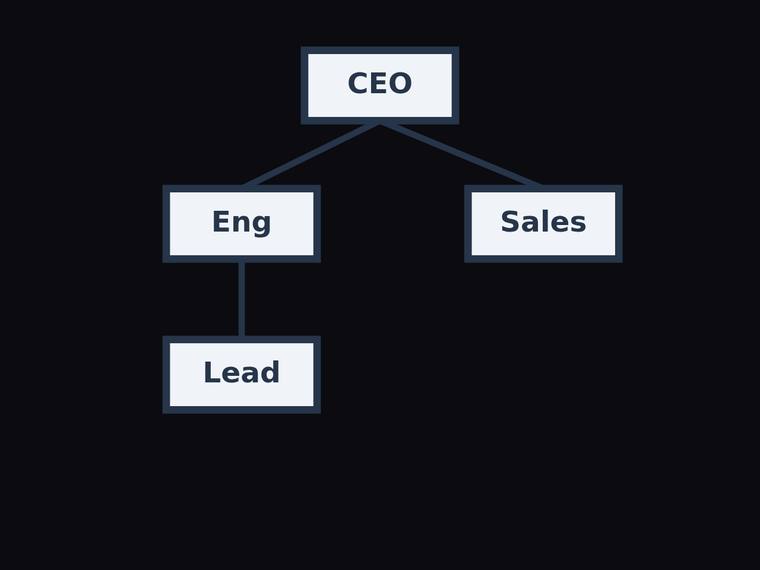
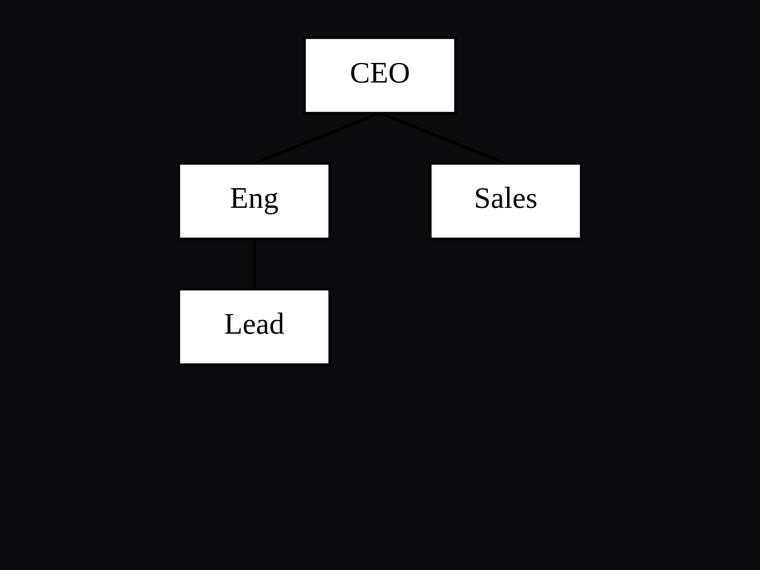
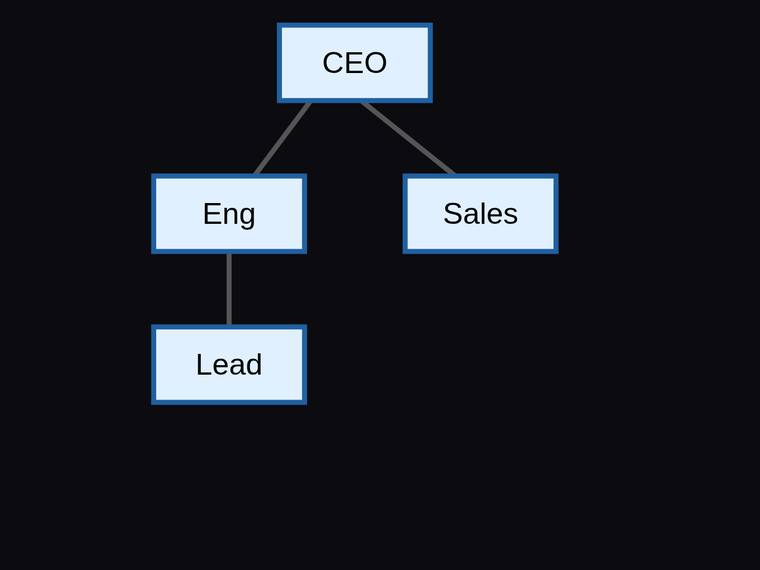
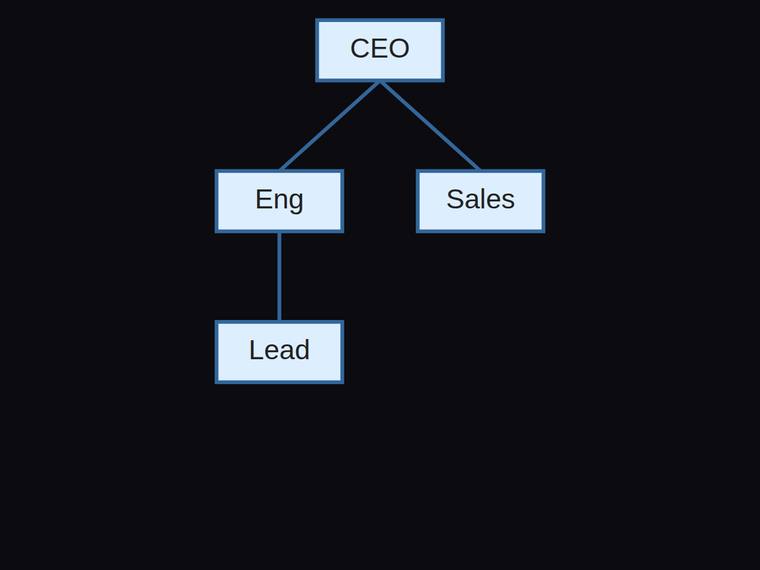
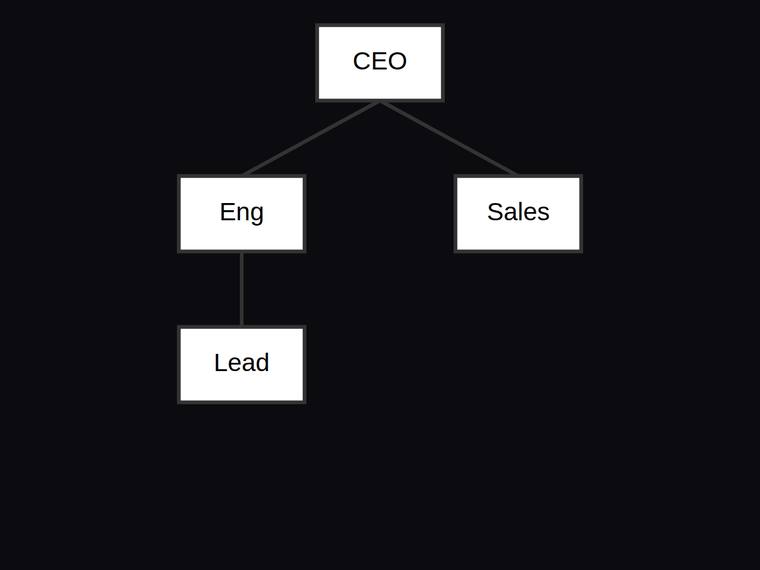
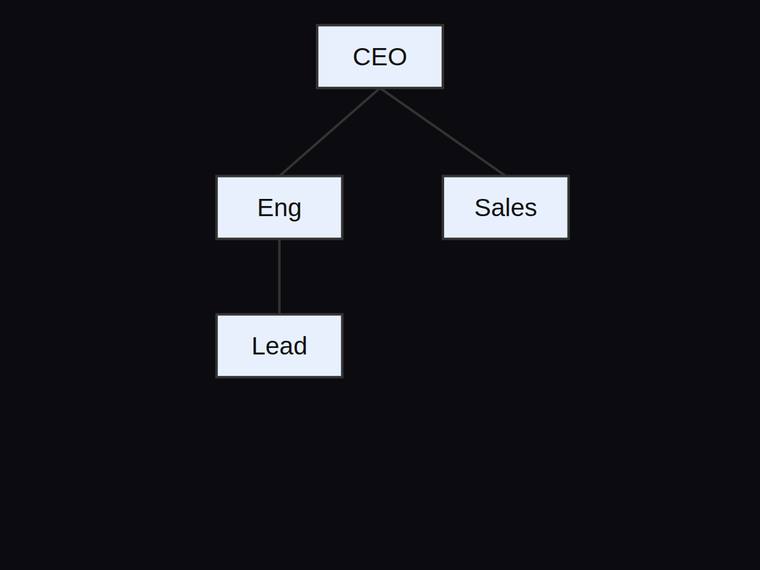
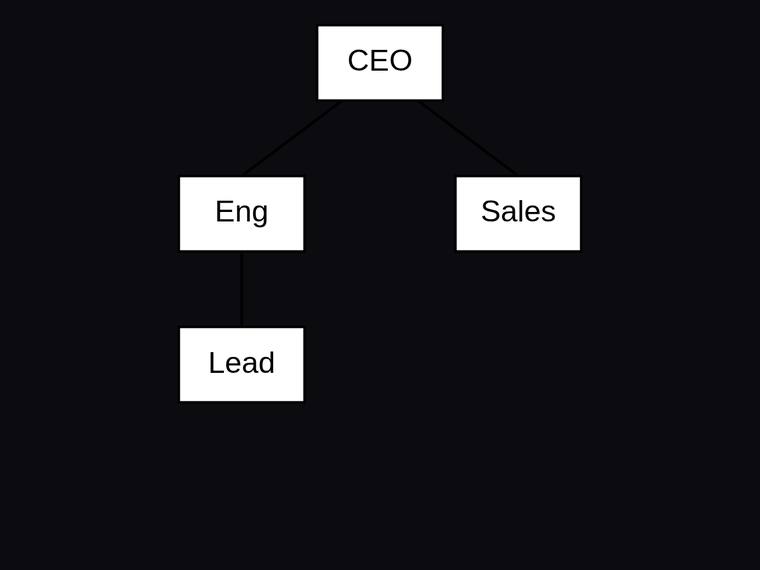
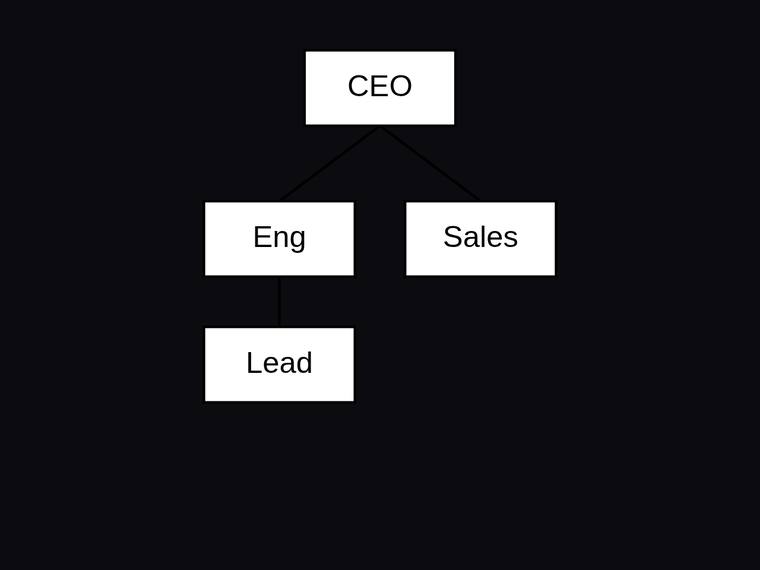
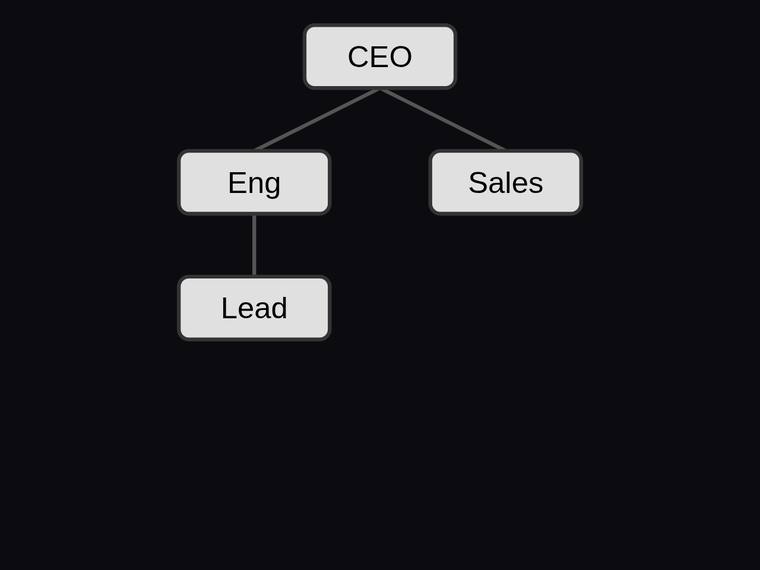
Org chart with three reporting edges and a fixed hierarchy
The same task, run on 27 models. Compare the outputs side by side, or open any one in a popup to inspect it.
Top result: claude-opus-4-8 (low reasoning) at 100.0% composite. Lowest: deepseek-v4-flash at 100.0%. 27 models compared on this task.
How it ran
- Each model was given the brief below in a fresh, isolated session with no access to our tools, and returned its answer from scratch.
- The rendered output was scored 1 to 5 on brief fidelity, visual design, craft, and impact by a four-family vision panel - Anthropic (Claude Opus 4.8), OpenAI (GPT-5.5), Google (Gemini 3.1 Pro), and xAI (Grok 4.3) - using one identical prompt so the scores compare. The published judge score is leave-one-family-out: a model is never scored by a judge of its own family, so same-family self-preference is removed.
The brief
Draw an organisation chart in SVG using a 200x170 viewBox. Write it to `chart.svg`. There are four role boxes, each a `<rect class="box">` with the listed id and label, and three reporting edges, each a `<line class="edge">`: Boxes (id : label): - box-ceo : CEO - box-eng : Eng - box-sales : Sales - box-lead : Lead Edges (exactly three `<line class="edge">` elements): - CEO -> Eng - CEO -> Sales - Eng -> Lead Layout rules: - CEO is above Eng and above Sales (CEO has the smallest y). - Eng is to the left of Sales. - Eng is above Lead. - No two boxes overlap. - Put each role label (CEO, Eng, Sales, Lead) in a `<text>` element. - Vector primitives only: no raster images, no data: URIs, no base64, no <foreignObject>, no <script>, no external references.