Banja Lab / Benchmarks / Test
DIAGR-0003SVG and graphics · hard
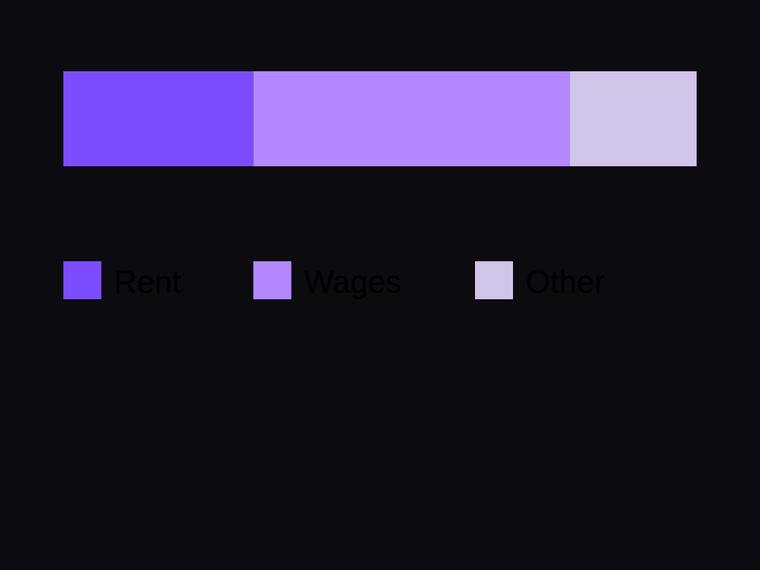
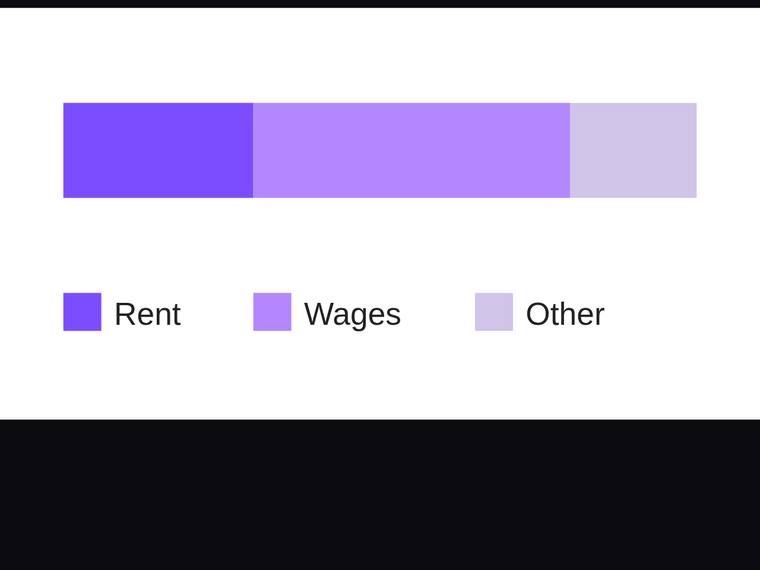
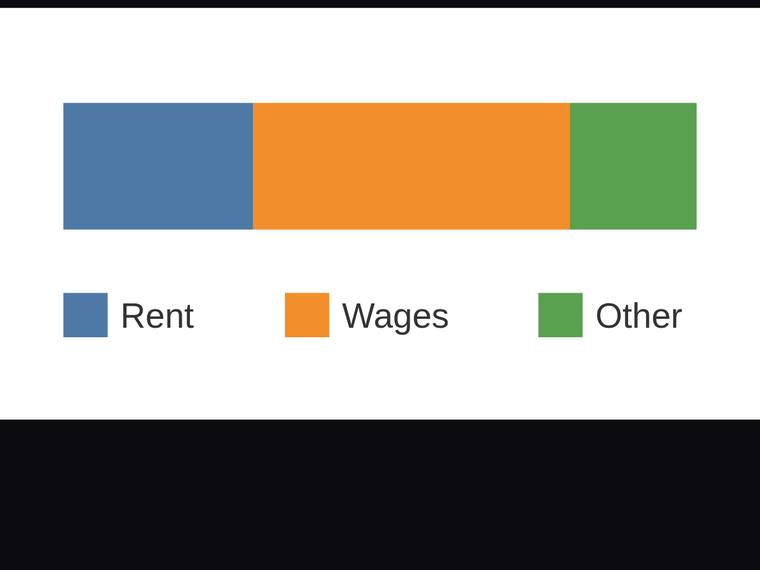
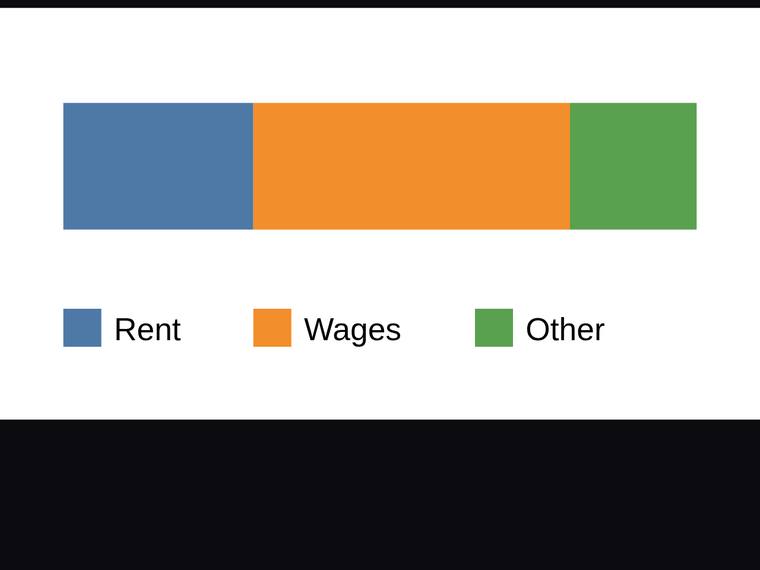
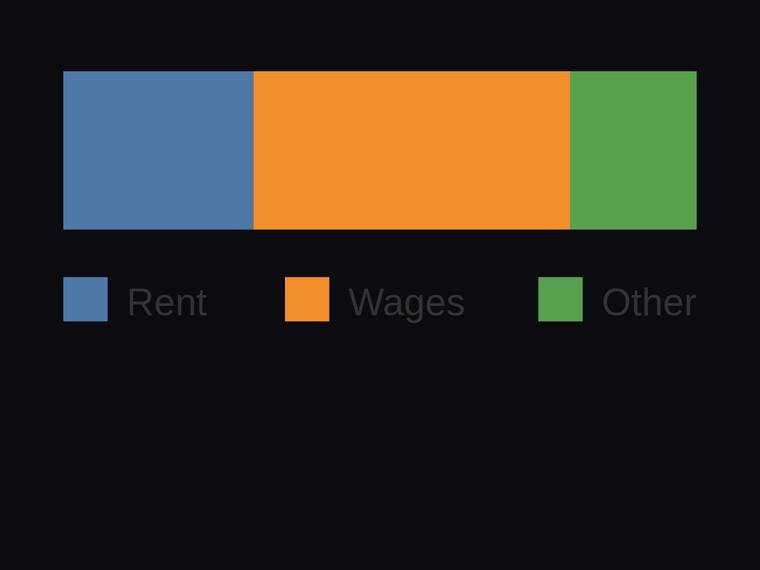
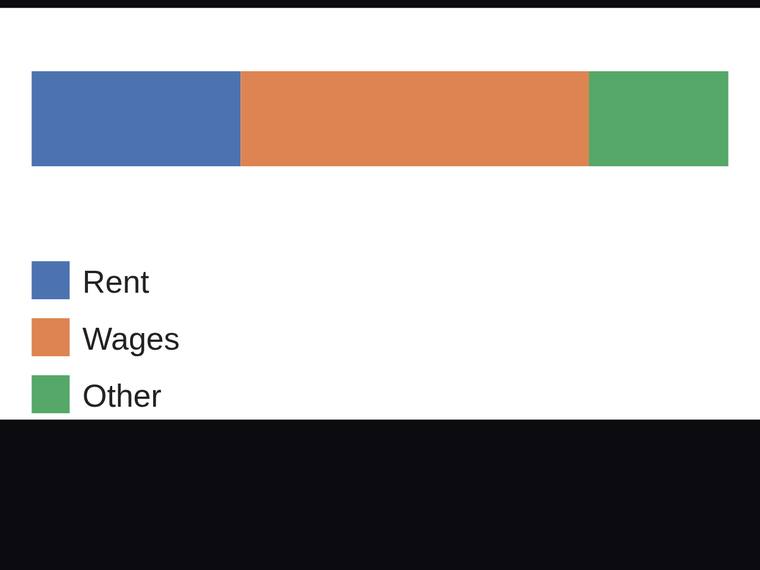
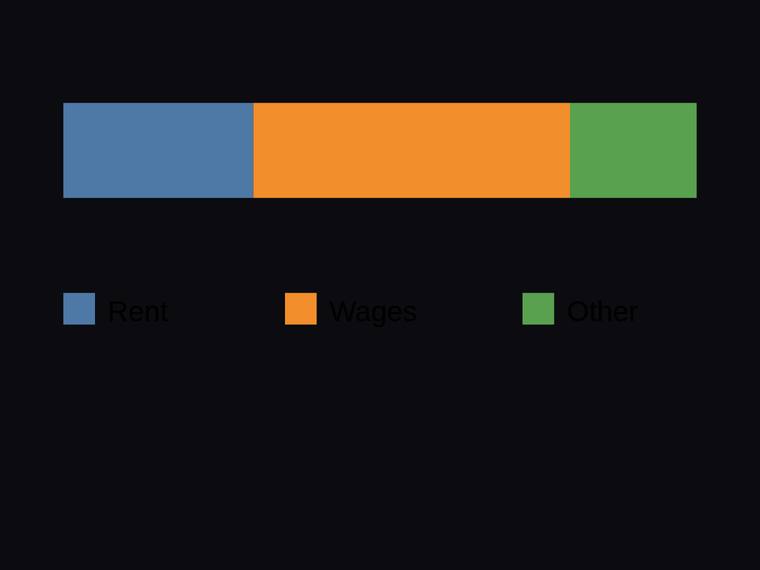
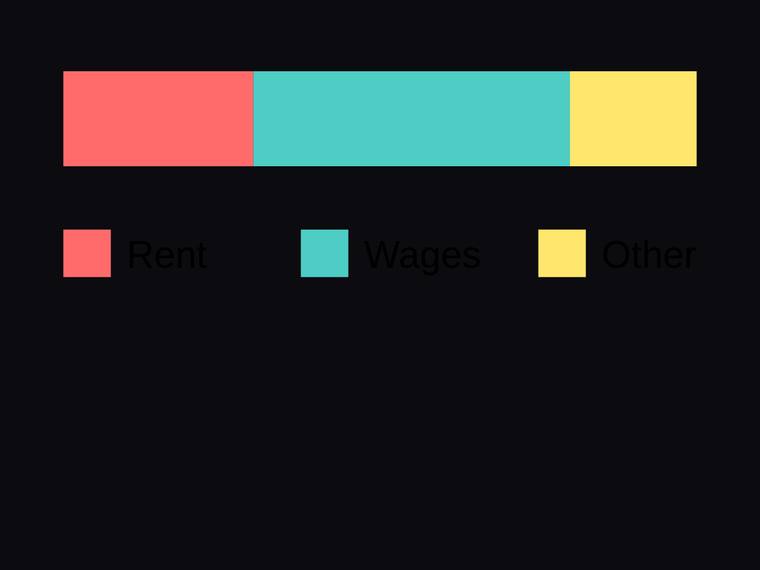
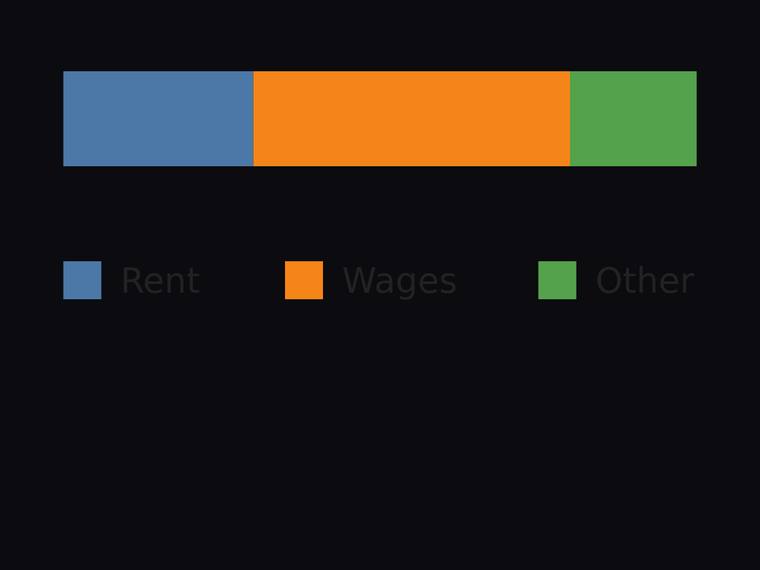
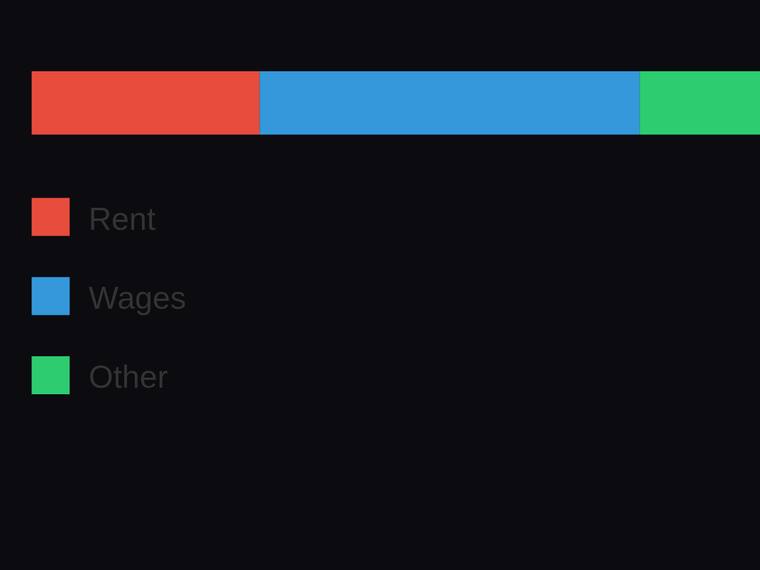
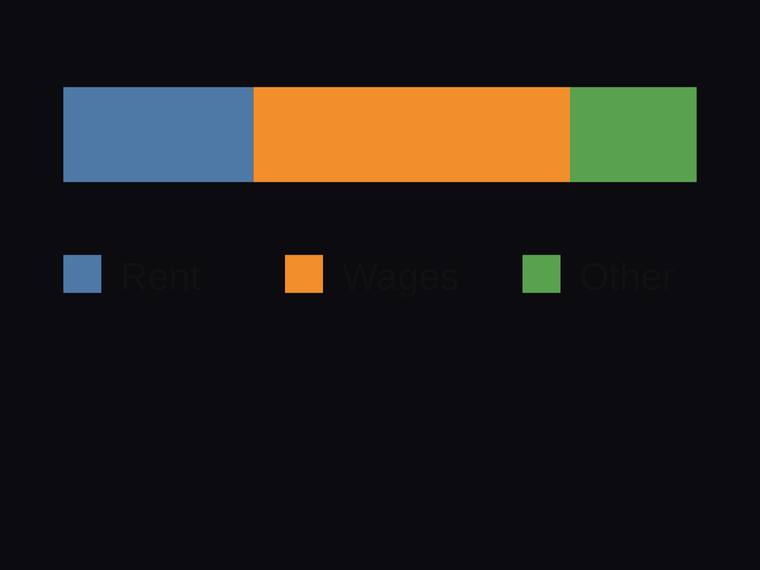
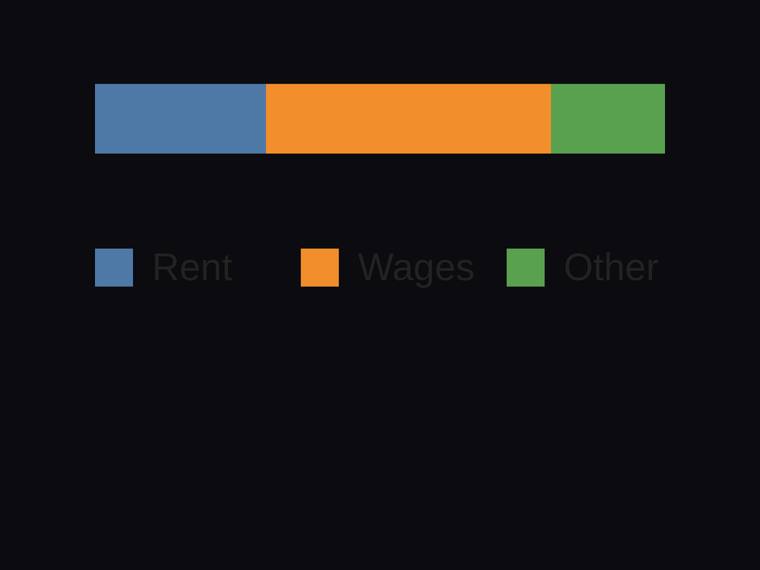
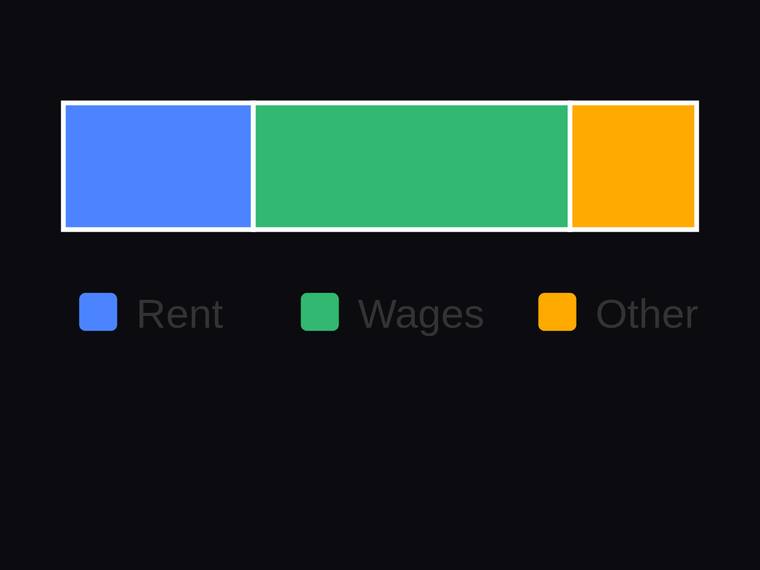
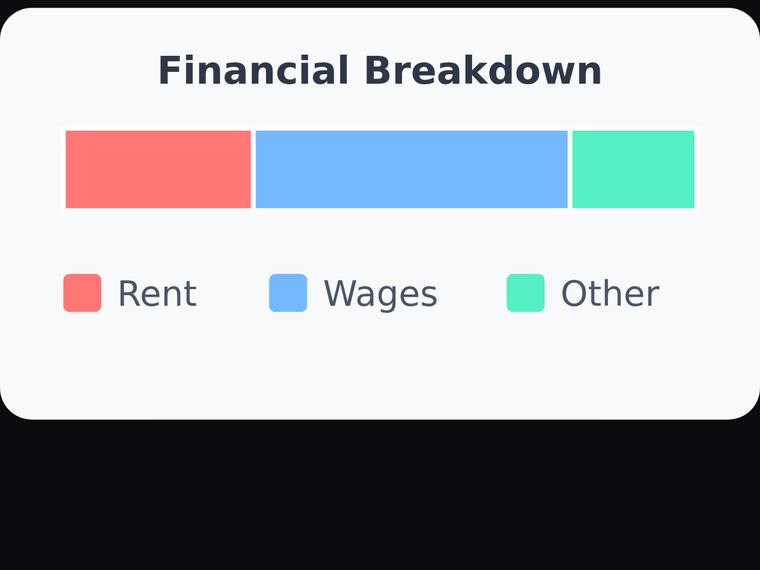
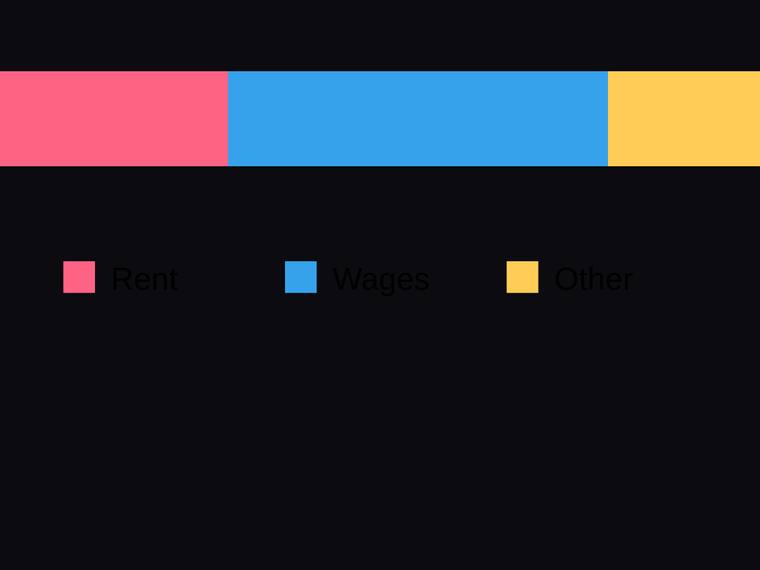
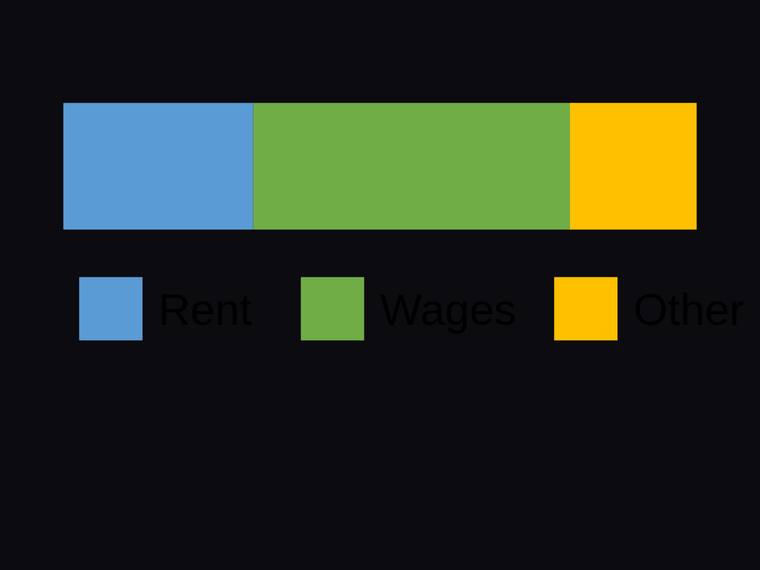
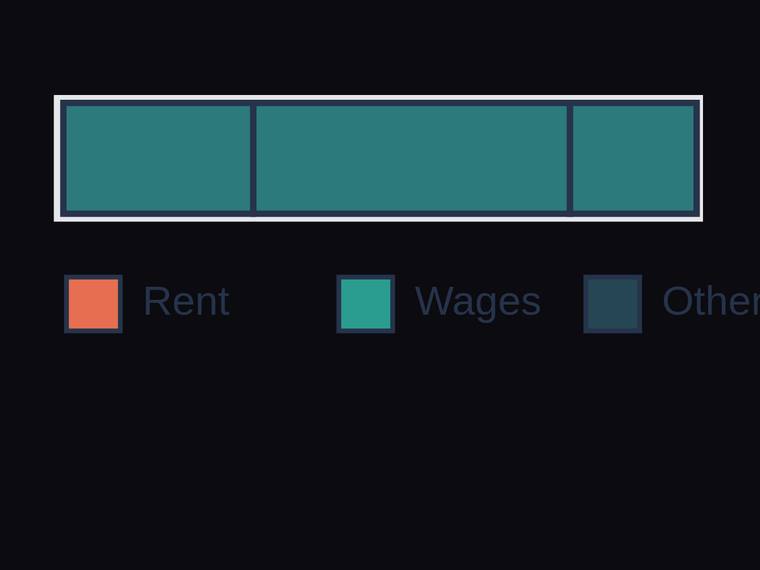
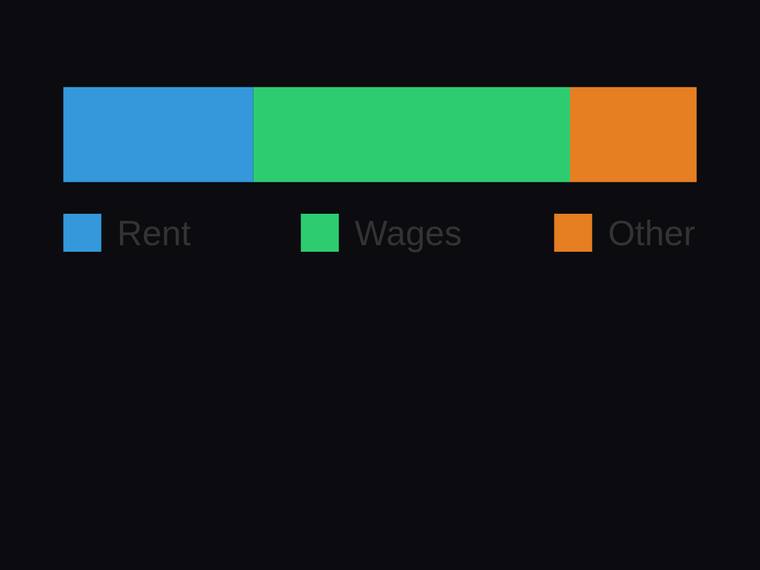
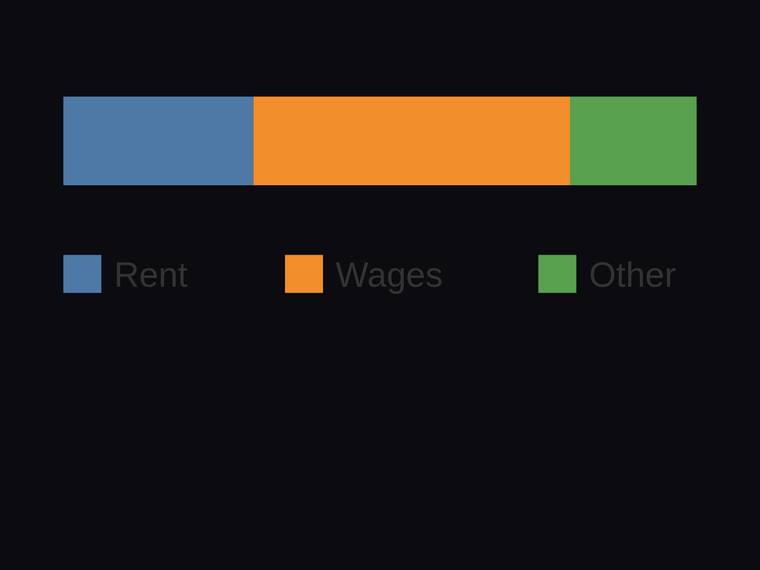
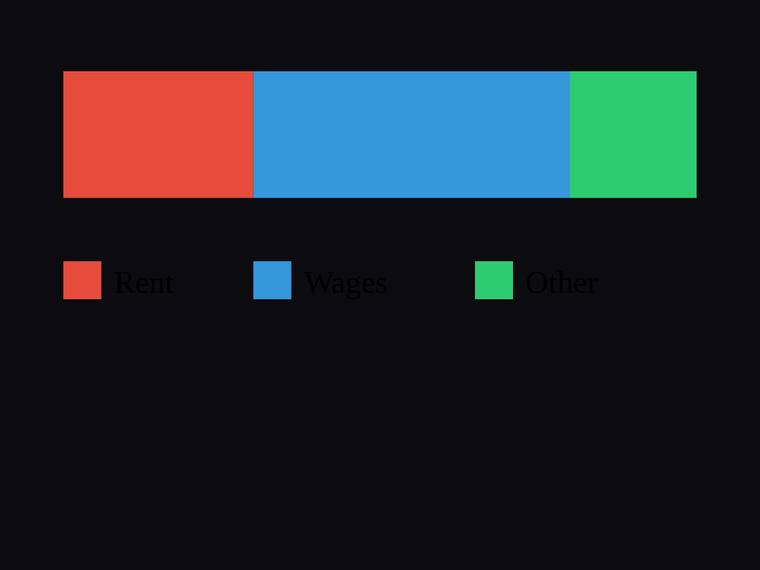
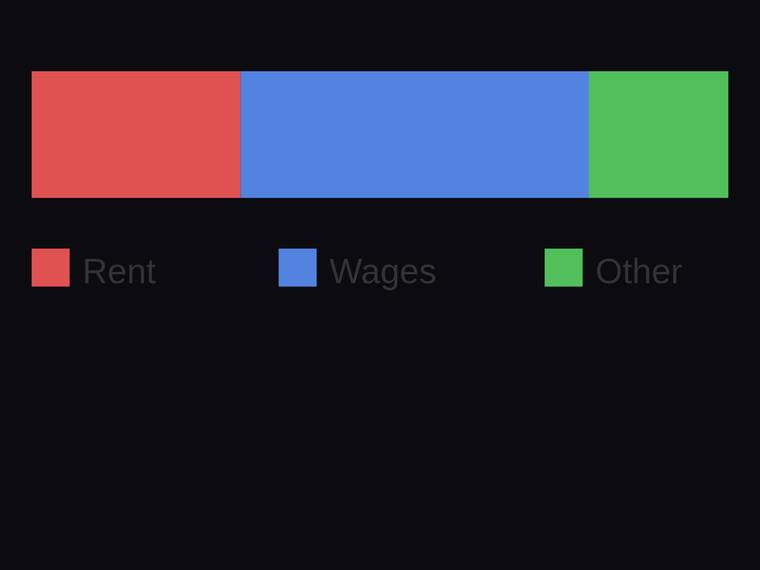
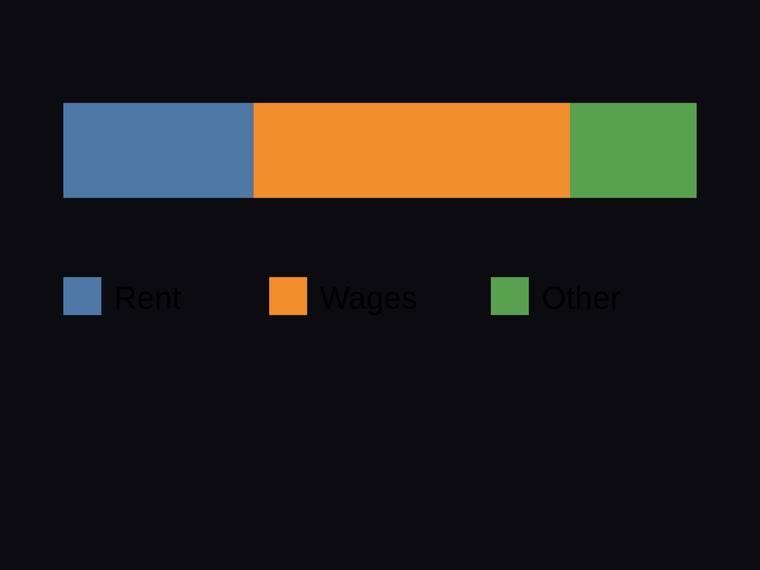
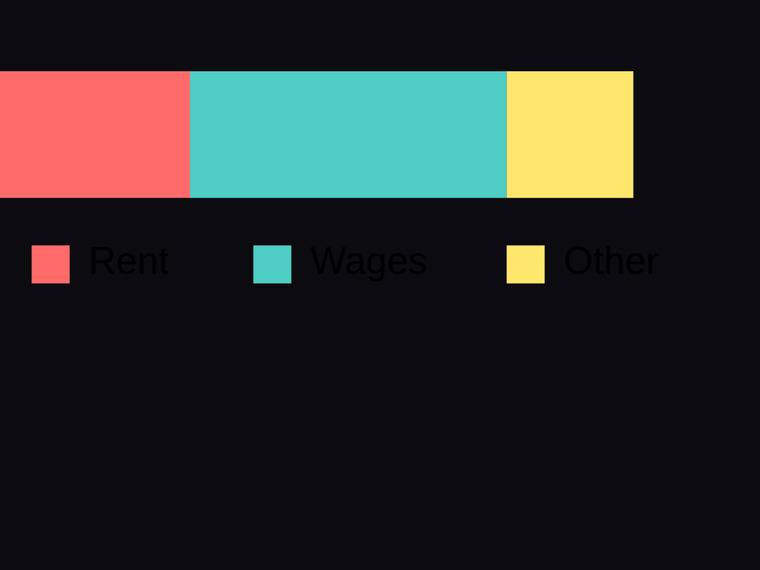
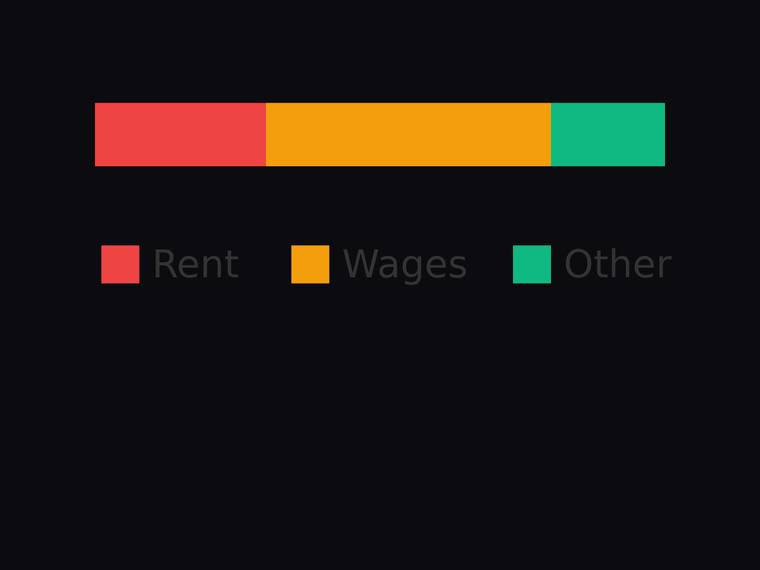
Horizontal stacked bar with proportional segments and a legend
The same task, run on 27 models. Compare the outputs side by side, or open any one in a popup to inspect it.
Top result: claude-opus-4-8 (low reasoning) at 100.0% composite. Lowest: deepseek-v4-flash at 100.0%. 27 models compared on this task.
How it ran
- Each model was given the brief below in a fresh, isolated session with no access to our tools, and returned its answer from scratch.
- The rendered output was scored 1 to 5 on brief fidelity, visual design, craft, and impact by a four-family vision panel - Anthropic (Claude Opus 4.8), OpenAI (GPT-5.5), Google (Gemini 3.1 Pro), and xAI (Grok 4.3) - using one identical prompt so the scores compare. The published judge score is leave-one-family-out: a model is never scored by a judge of its own family, so same-family self-preference is removed.
The brief
Draw a single horizontal stacked bar chart in SVG using a 240x130 viewBox. Write it to `chart.svg`. The bar is split into three segments, each a `<rect class="seg">` with the listed id, laid out left to right in this order, with widths proportional to the values: - seg-rent : Rent = 30 - seg-wages : Wages = 50 - seg-other : Other = 20 So the Wages segment is the widest and the Other segment the narrowest, and the segment width ratios match the value ratios. Below the bar, draw a legend: three `<rect class="swatch">` colour swatches and three `<text>` labels reading Rent, Wages, Other. Requirements: - Exactly three segment rects (class="seg") and exactly three swatch rects (class="swatch"). - Segment order left to right: seg-rent, then seg-wages, then seg-other. - All three labels present. - Vector primitives only: no raster images, no data: URIs, no base64, no <foreignObject>, no <script>, no external references.